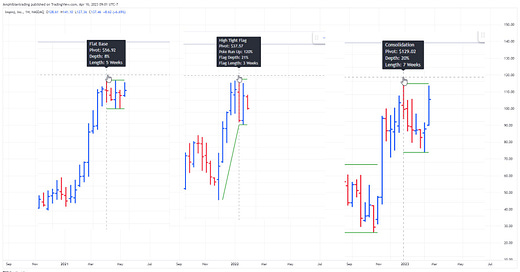
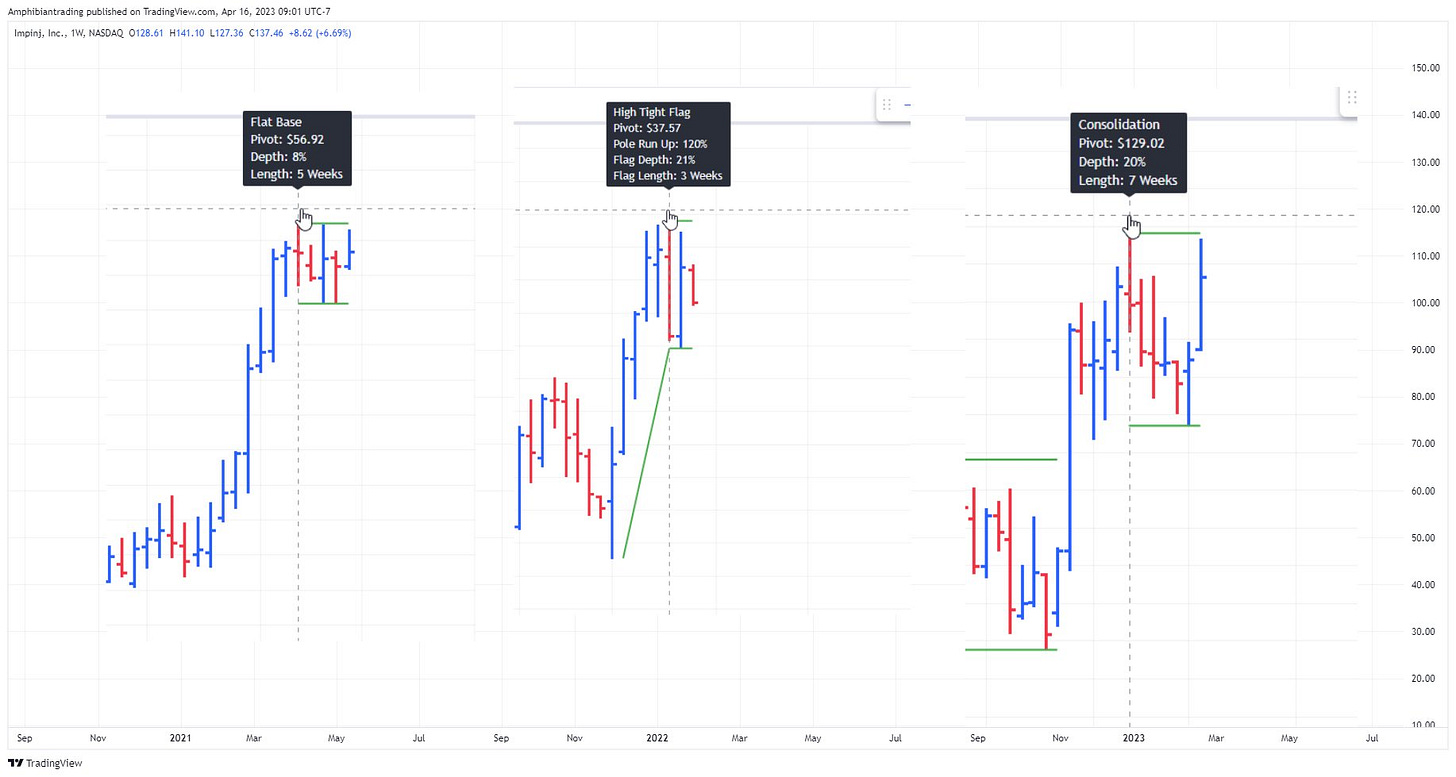
This one’s taken some time but it’s finally ready! I introduce you to Base Finder for TradingView.
The Base Finder for TradingView is a powerful tool to identify consolidation periods in a stock's advance. With this indicator, traders can effortlessly spot consolidation patterns on their charts providing them with a deeper understanding of the stock's price action.
Base Finder goes beyond identifying consolidation patterns, as it also offers key information about the consolidation such as the depth, length, pivot point, and the number of accumulation or distribution weeks throughout the pattern. This information allows traders to compare and analyze the best basing patterns quickly and easily.
With Base Finder, traders can differentiate between a Flat Base, a High Tight Flag, or a consolidation, such as a cup with handle or double bottom base.
This tool helps traders of all levels train their eye to identify potential trading opportunities that might have otherwise gone unnoticed.
Base Finder is a must-have tool for any trader, especially those that have studied the work of William O’Neil and stacks up base for base with MarketSmith.
Easily customize the settings, from the look to the intricacies of a consolidation.
Default settings:
Flat Base
length: 5 weeks minimum
depth: <= 15%
High Tight Flag
Flag Pole: up 80% or more in less than 8 weeks
Flag: Less than 25% correction in 2-4 weeks
Consolidation:
length: minimum 6 weeks
depth: <= 35%
Accumulation Week:
Current candle closes lower, but in the upper half of the weekly closing range on above average volume. OR Current candle closes positive in the upper 40% of the weekly closing range on above average volume.
Distribution Week:
Current candle closes positive, but in the lower quartile of the weekly closing range on above average volume. OR Current candle closes down on the week in the lower half of the weekly closing range on above average volume.
Notes
This indicator is meant to be used on the weekly timeframe.
In order to see the stats labels hover your mouse over the left side high of the consolidation and please make sure the indicator is brought to the front using the visual order of your chart. If the visual order is not correct you will not be able to see the stats label.
Thanks for reading! If you find this indicator helpful or know someone that could benefit from it please consider doing the following:
Follow me on Twitter @amphtrading
Share this post using the button below
Disclaimer:
This indicator is for informational and educational purposes only. Do your own research before making any trade decisions. We accept no liability for any loss or damage, including without limitation any loss of profit, which may arise directly or indirectly from use of or reliance on this indicator.


