Base Finder for TradingView is a powerful tool to identify consolidation periods in a stock's advance. With this latest update, Base Finder is raising the bar, taking pattern recognition to another level.
The new version Base Finder not only finds consolidations, but also now has the ability to show the following:
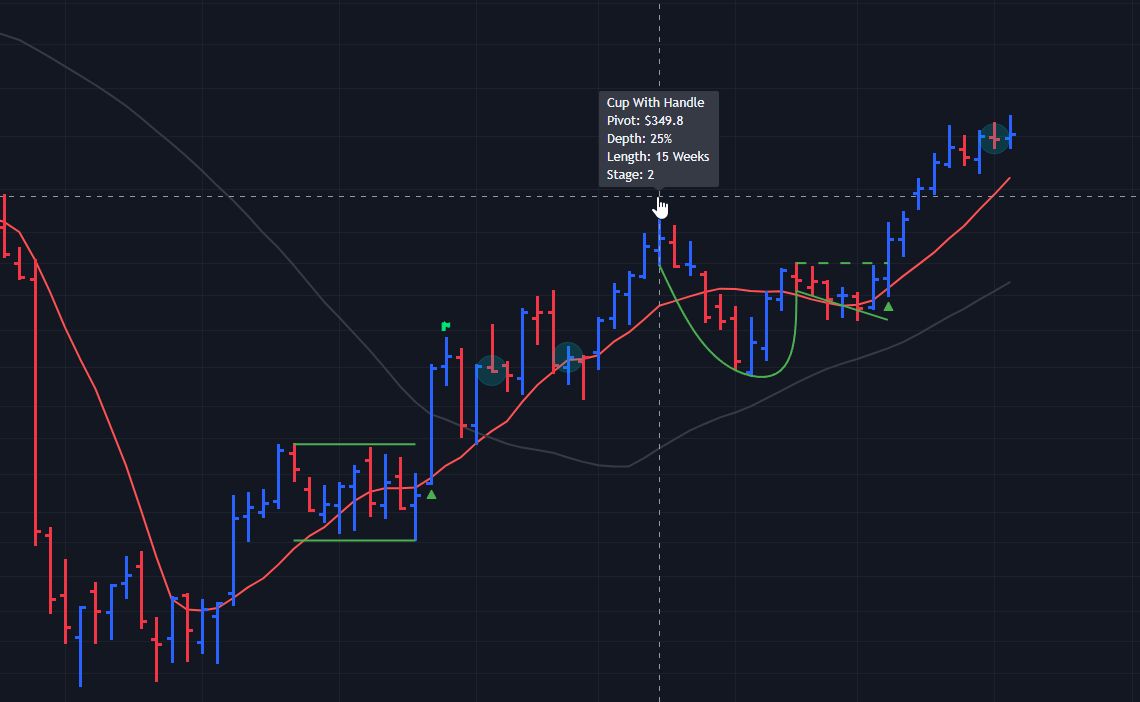
Cup with Handles
Base Stages
Heavy Volume Without Further Price Progress
3 Weeks Tight
Base Flaws
Profit Target Reached / 8 Week Hold Rule Flag
Sell Signals
Base Health Table
Let’s take a look at each update individually now.
Cup With Handles
A Cup with Handle is a powerful basing pattern found at the beginning of many major winning stocks' advances. The pattern resembles a tea-cup when viewed from the side. The handle must be a minimum of one week long and should be in the upper half of the base. Additionally, the midpoint of the handle should be above the midpoint of the cup.
Base Stages
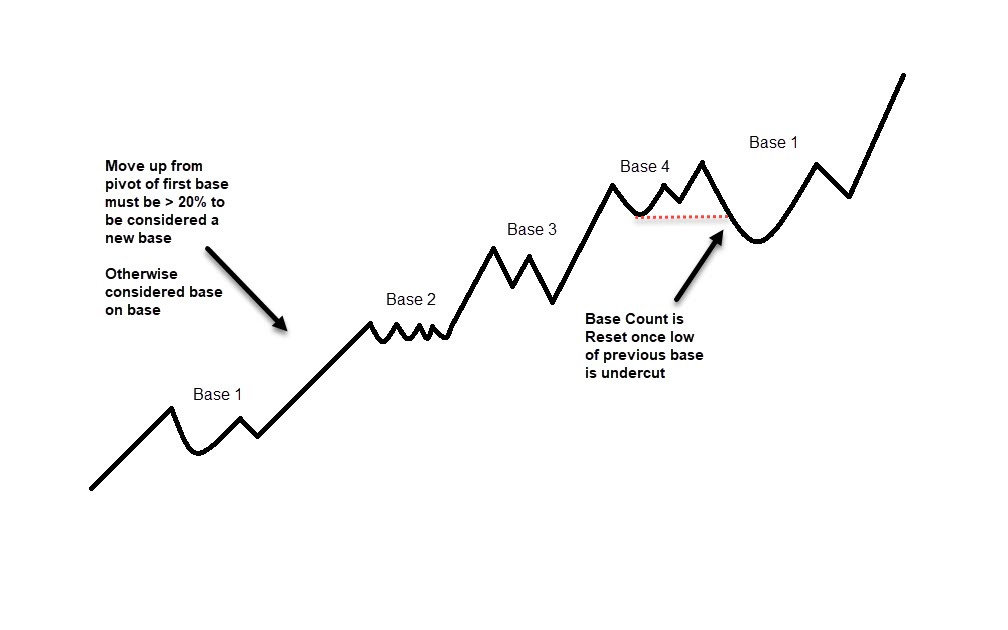
When analyzing bases on a chart, it's crucial to consider the stock's stage in its lifecycle. The most promising bases are typically the first and second ones. By the time a third or fourth stage base forms, it becomes too obvious and is more prone to failure.
Heavy Volume Without Further Price Progress
Heavy volume without further price progress can be a subtle clue of distribution or accumulation. After a stock has made a big move it can indicate a period of consolidation may be needed. On the other hand, while consolidating near the lows if a stock fails to go lower despite heavy volume a significant low could be in.
3 Weeks Tight
3 Weeks Tight occurs when a stock closes within 1.5% of the prior weeks close for two straight weeks. This type of action suggests overall demand for a stock at that level is high.
Base Flaws
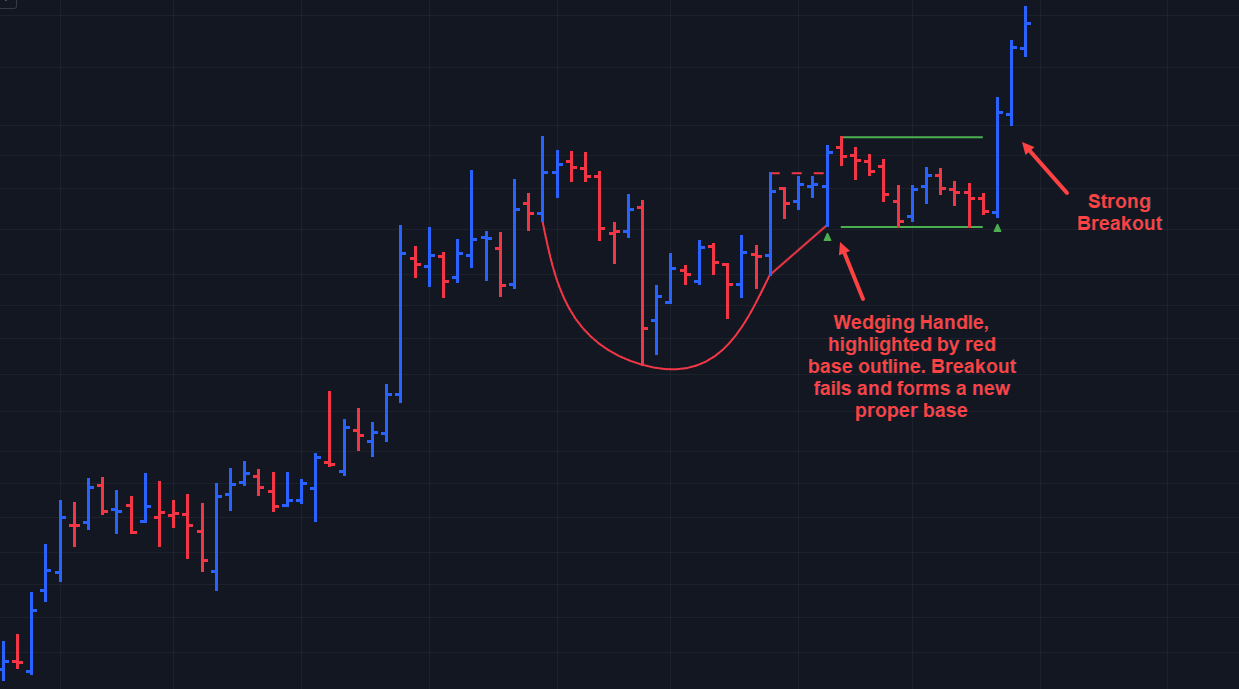
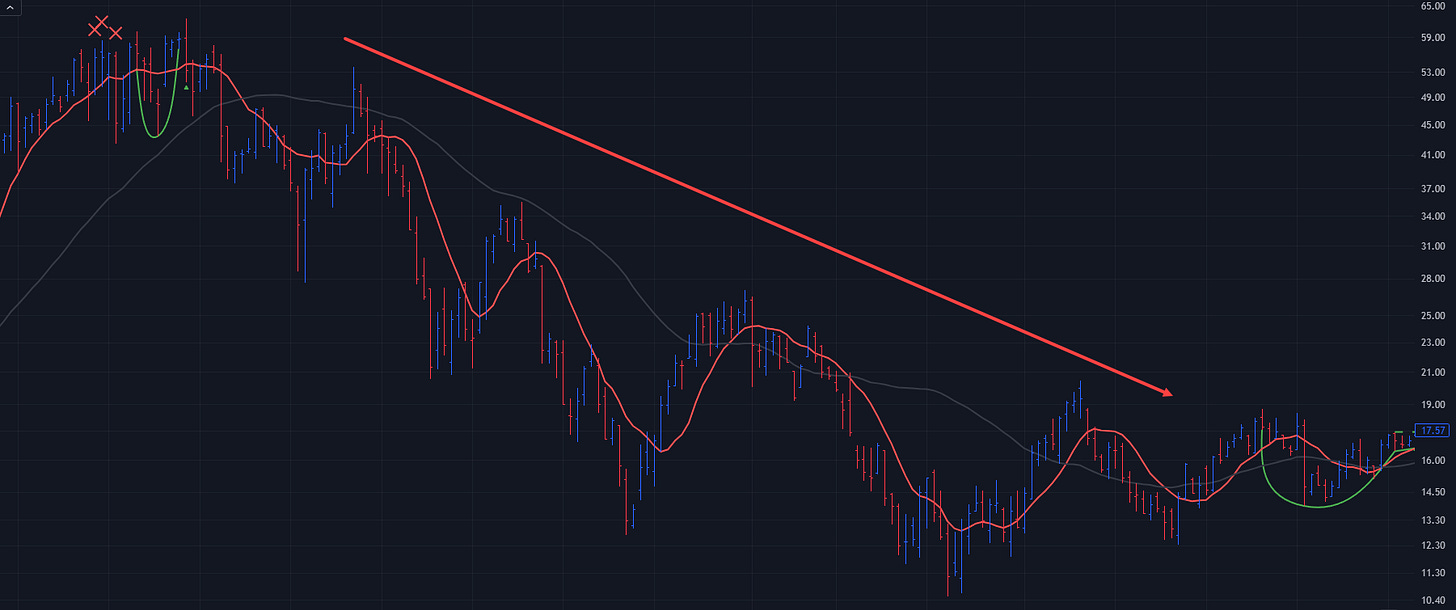
Not all basing patterns are created equal. While some flawed bases will still work, this is here to serve as a warning. The first flaw Base Finder looks for is living below the 10-week line. If a base spends 8 or more weeks below the 10-week line, it is considered to be living below the 10-week line and in most cases should be avoided. The second flaw Base Finder looks for is a wedging handle in a Cup with Handle base. Wedging refers to the lows in the handle drifting upward, not allowing the handle to shakeout any weak holders.
Profit Target Reached / 8 Week Hold Rule
Typically, stocks tend to advance 20% to 25% after breaking out from a base before they start forming a new base or consolidation. Once a stock has broken out from a base and has not triggered the user set stop loss zone, Base Finder will show when the profit zone is reached. The exception to this is when a stock is so powerful it advances 20% or more within 3 weeks of breaking out of a proper base. When this happens that triggers the 8 Week Hold Rule and a flag is shown. In many cases stocks that move this quick and powerful are capable of going on big runs.
Sell Signals
While everyone worries about when to buy stocks, selling stocks is ultimately just as, if not more important. Base Finder now identifies 4 key sell signals and considers where a stock is in its run.
Bad Break of 10 Week Moving Average – A close 4% or more below the 10 week moving average on increasing volume. Only flagged if a new high was made in the last 6 weeks and the 10-week moving average is above the previous base pivot.
2 Weeks Down 2 Weeks Up – A sell signal that usually occurs after a longer run. This occurs when a stock falls down to its 10-week moving average in 1 or 2 weeks and then quickly goes back to new highs in 1 or 2 weeks. This will only be flagged if the stock is 18 weeks from a stage 1 or 2 base breakout or 12 weeks from a later stage base.
Railroad Tracks – This occurs following a significant rally and is characterized by two consecutive weeks of large price swings, with the second week closing within 1% of the first week's close. This is a sign of distribution without further price progress. This will only be flagged if the stock is 18 weeks from a stage 1 or 2 base breakout or 12 weeks from a later stage base.
Climax Top – A rare sell signal that a leading stock is overheated and may be in the process of topping. This typically includes a very rapid price advance, huge volume and the largest weekly spread of the stocks run. This will only be flagged if the stock is 18 weeks from a stage 1 or 2 base breakout or 12 weeks from a later stage base.
Base Health Table
The Base Health Table serves as a quick snapshot to view the overall health of a base. The table includes the following
Net Accumulation / Distribution Weeks – Calculated by subtracting the number of distribution weeks from the number of accumulation weeks. A positive number indicates overall accumulation.
Tight Weeks – The number of weeks with tight weekly closes in the base. A 'tight' close is defined as being within less than 1.5% of the previous week.
Highest Volume – shows if the highest volume week of the base is an accumulation or distribution week.
Largest Spread – shows if the largest weekly spread of the base is an accumulation or distribution week.
RS Weeks – The number of weeks the stock outperformed its benchmark with positive alpha, indicating alpha-adjusted RS.
Flaws – Shows what flaw is present in the base, if any.
Notes
This indicator is meant to be used on the weekly timeframe.
In order to see the stats labels hover your mouse over the left side high of the consolidation and please make sure the indicator is brought to the front using the visual order of your chart. If the visual order is not correct you will not be able to see the stats label.
Thanks for reading! If you find this indicator helpful or know someone that could benefit from it please consider doing the following:
Follow me on Twitter @amphtrading
Share this post using the button below
Disclaimer:
This indicator is for informational and educational purposes only. Do your own research before making any trade decisions. We accept no liability for any loss or damage, including without limitation any loss of profit, which may arise directly or indirectly from use of or reliance on this indicator.


