On the surface the Nasdaq appeared to have a fantastic week gaining close to 4.5% and punching through a trendline that acted as resistance just two weeks ago. Unfortunately, breadth didn’t match this as the skewed weighting of the Nasdaq masked what was happening underneath the surface. The easiest way to see this is to compare the QQQ and the QQQE (Nasdaq 100 equal weighted). Looking at these side by side it’s obvious to see the QQQE significantly underperformed the QQQ.
Before we dive into more analysis make sure you are subscribed so that you don’t miss any future updates!
Taking a closer look let’s examine why this happened. The following chart shows the percentage of stocks above the 50 day and 200 day moving averages, which should have spiked this week with the index being up so much. On top of that, and my biggest concern is the net highs and lows, which continue to show expanding net lows (red background bottom of the chart).
An easy way to get a snapshot of this is with my Market Stop Light indicator for TradingView. Which gives clear signals on price action and the net highs and lows. To learn more about this indicator and add it to your charts click the link below.
Now despite all of that, it is important to keep track of stocks that are showing relative strength and forming proper basing patterns. The market and breadth can flip on a dime, especially with an FOMC announcement coming next week.
We are currently 5 days into a new rally attempt which means a valid Follow Through Day signal could happen any day. Below are 5 stocks that I am watching very closely.
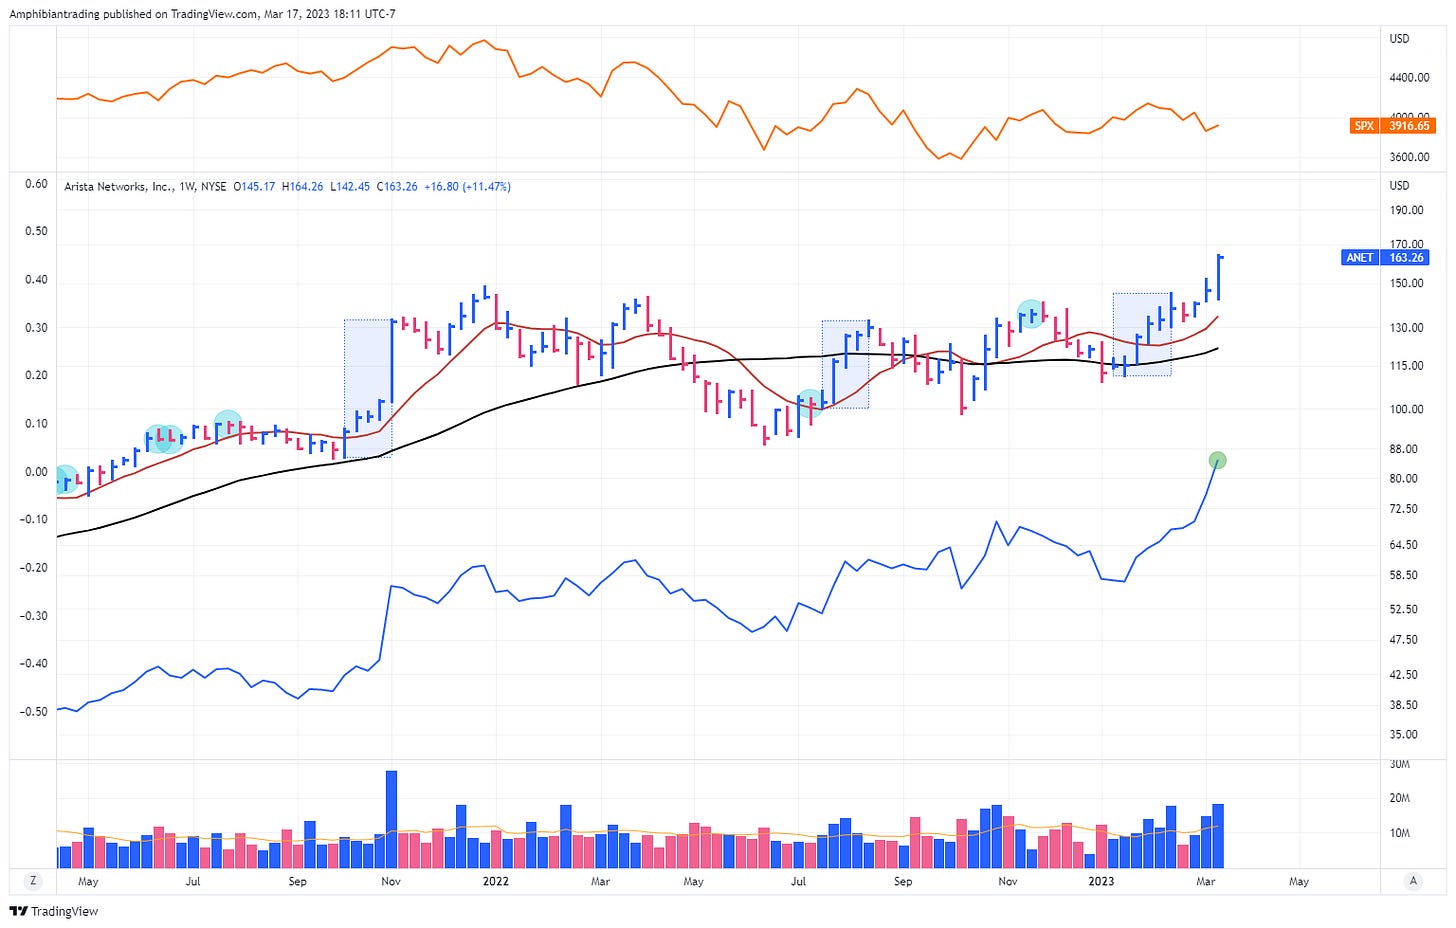
New highs for both price and relative strength on big volume. A bit extended here, but TML potential.
Undercut and closed above the 10 week moving average on above average volume. RS line continues moving higher as the stock shows accumulation on all time frames.
Four weeks into a potential flat base after finding support at the 10-week moving average early in the week. Volume has dried up while this consolidation forms and shows clear accumulation during the previous run up.
Newer IPO with earnings next week. Price consolidating just under this weekly trendline and could push higher with a positive reaction to earnings. Nice volume profile with larger up weeks.
Another recent IPO that is acting well. Earnings were a catalyst two weeks ago with the relative strength line going vertical. Extended here, but one to watch.
Thanks for reading! If you enjoyed this article please help support my work by doing the following:
Follow me on Twitter @amphtrading
Share this post using the button below
The content presented is for informational and educational purposes only. Nothing contained in this newsletter should be construed as financial advice or a recommendation to buy or sell any security. Please do your own due diligence or contact a licensed financial advisor as participating in the financial markets involves risk.


