How to Replicate a Marketsmith Chart in TradingView
What settings to change and indicators to use
If you’ve ever used Marketsmith you know it is a top-notch charting platform with unmatched scanning abilities and a very clean look. Maybe Deepvue can challenge that now, but I haven’t got to test it yet.
While Marketsmith is great and something I use daily, if you don’t have a subscription to it or want to have some extra technical analysis tools, it is fairly simple to recreate the look and feel of a Marketsmith chart in TradingView by changing a few settings and adding the right indicators.
In this article, I’ll show you what settings you need to change and what indicators to use to create a very close replica of a Marketsmith chart. If you prefer a video walk through, you can scroll down to the bottom and skip the reading.
Before we dive into how to recreate the chart, make sure you are subscribed so that you don’t miss any future updates!
The first thing you’ll need to do in TradingView is start a new chart layout.
From there you’ll want to switch your candle type to bars and then right click anywhere on the chart and open the settings menu or click the gear icon in the top right corner to open the settings menu.
Once you have the settings menu open, you will want to make sure “Color bars based on previous close” and “HLC bars” are checked, while “Thin bars” is unchecked. You will also want to change the bar colors to be blue for “up color” and a reddish pink for “down color”.
Now that the bars are set up correctly, it’s time to adjust the volume settings. This can be done by hovering over where it says “Vol” under the ticker symbol and company info on the top left of the chart and clicking the gear icon.
Once in the volume settings adjust the “MA Length” to 10 if using a weekly chart, or 50 if using a daily chart and select “color based on previous close”.
In the style section of the volume settings, change the color of “growing” to match your up day bar color and the “falling” color to match your bar color for down days. Check the “Volume MA” and select whichever color you’d like.
The last thing you’ll need to do for the volume is to move it to a new pane below. This is done by once again hovering over where it says “Vol”, but this time clicking the three dots at the end and selecting “move to” instead of the gear icon for settings. Moving the volume to a pane below will allow you to resize it as you do your chart work.
Now the fun part of adding indicators. All the indicators were created by John Muchow, that is a simple way to tell you are using the correct one. I’ll list all the indicators here and the show you the settings I use to mimic the look of a Marketsmith chart.
Moving Averages For All Timeframes
These are the settings I use for my weekly moving averages, feel free to chose whichever moving average you typically use. The color selection (red and black) matches a Marketsmith weekly chart.
RS Line - Gauge Performance vs Index
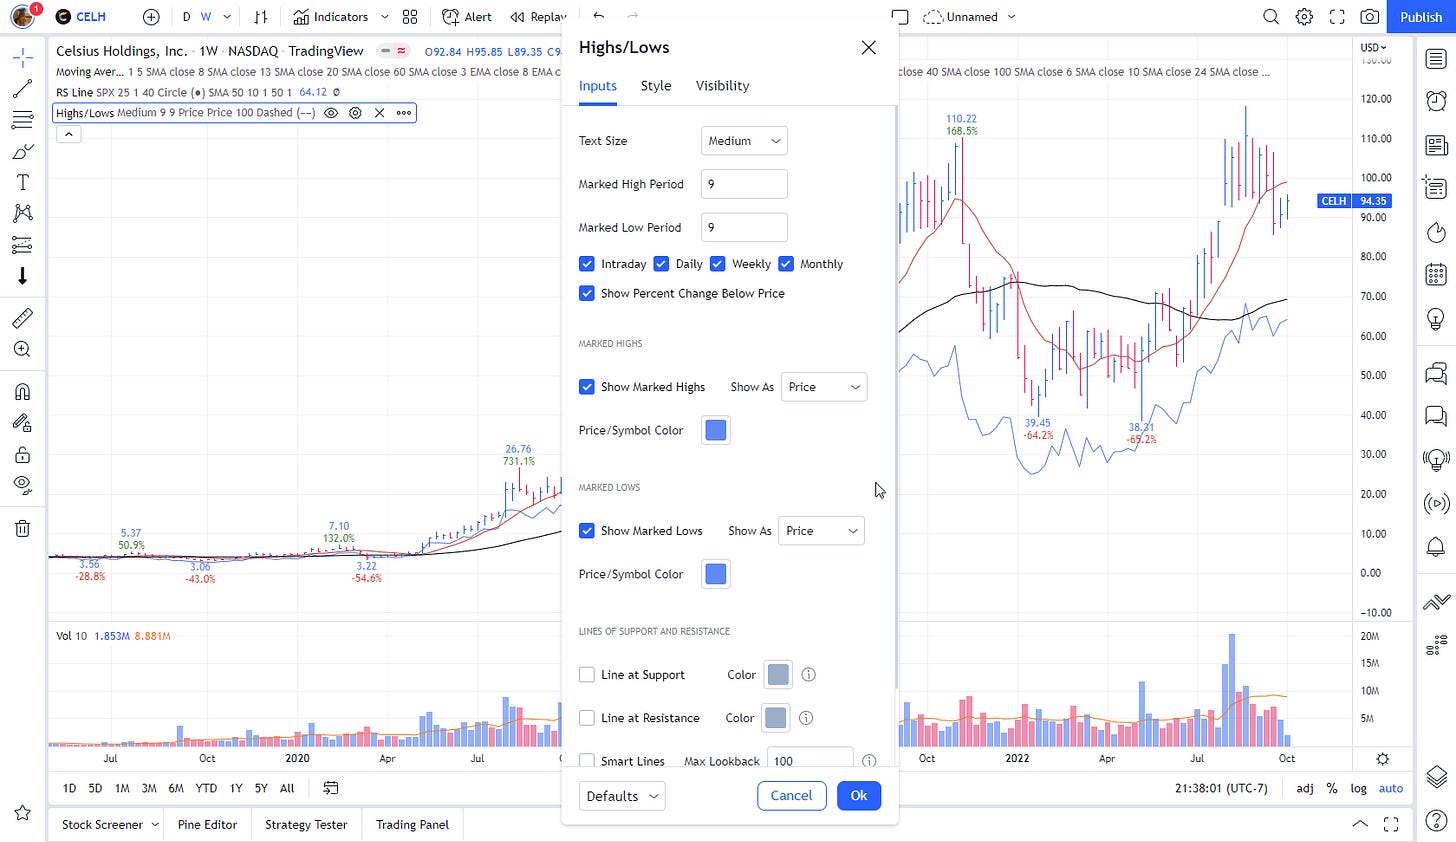
Marked Highs/Lows - Support & Resistance
A nice feature here that Marketsmith doesn’t have is the ability to show a percent change as well as price.
Price Stats
You can chose to show this data as a table in multiple areas on the chart or directly after the last bar. I prefer to keep it on the left hand side as a table.
Earnings, Sales & Volume Dashboard
Another great feature here that Marketsmith doesn’t have is the ability to plot the EPS on the chart as a line.
The very last thing you’ll want to do is add an index line to the chart. You can do this by hitting the compare button which is the circle with a plus sign in it right next to the charts ticker symbol.
You will add the SPX to a new pane. The pane may show up at the bottom of the chart, you can use the arrow on the right side of that pane to move it to the top. You can also change the color of this line to black in the settings to match Marketsmith.
That’s it now you have a very good replica of a Marketsmith in TradingView. Lets take a look at the two next to each other.
Marketsmith
TradingView
Thanks for reading! If you enjoyed this article please help support my work by doing the following:
Follow me on Twitter @amphtrading
Share this post using the button below


Freakin awesome, thanks!