The market continued higher this week despite the Fed raising rates as money continues to pour into mega cap tech. For the week the Nasdaq 100 was the strongest index, gaining close to 2% while the Nasdaq Composite finished up 1.66%, and small caps (IWM) finished up a mere .33%.
Before we dive into more analysis make sure you are subscribed so that you don’t miss any future updates!
If we take a look at the index ETF’s since the beginning of the year the QQQ is the runaway leader, again showing the imbalance of weightings in the index. Despite there being 100 stocks in the Nasdaq 100, the top 5 holdings (MSFT, AAPL, AMZN, NVDA, GOOGL) account for 44% of the index.
This is even more noticeable when looking at the net highs and lows, which shows expanding net lows, as well as the percentage of stocks above their 50 and 200-day moving averages. With banks unstable, money has flown into these massive cash rich companies.
To further illustrate this point, I want to compare the Nasdaq Composite to the QQQ using my IBD Market School indicator, that will be out soon on TradingView. For anyone not familiar with the Market School system, there is a running count that is added to or subtracted to based on very strict buy and sell rules. The total of the running count dictates appropriate exposure levels.
Looking first at the Nasdaq Composite, after a brief Power Trend (highlighted green background) a circuit breaker was triggered on March 13th signifying it was time to be out of the market. We are now 10 days into a rally attempt and need a Follow Through Day to turn on the buy switch.
Jumping over to the Nasdaq 100 now, there is a significant difference. The Power Trend is still on and the system says exposure up to 100% would be acceptable.
We also heard from the Fed this week as the FOMC decided to raise interest rates by a quarter point, which was widely expected. At this point the Fed has removed the terms “higher for longer” from their statement and the market is expecting rate cuts later in the year, and a pause at the Feds next meeting in May.
With the lopsided action, similar to last week at this point the best thing to do is continue to monitor stocks that exhibit Relative Strength and watch for breadth to improve under the hood, or a Follow Through Day to occur.
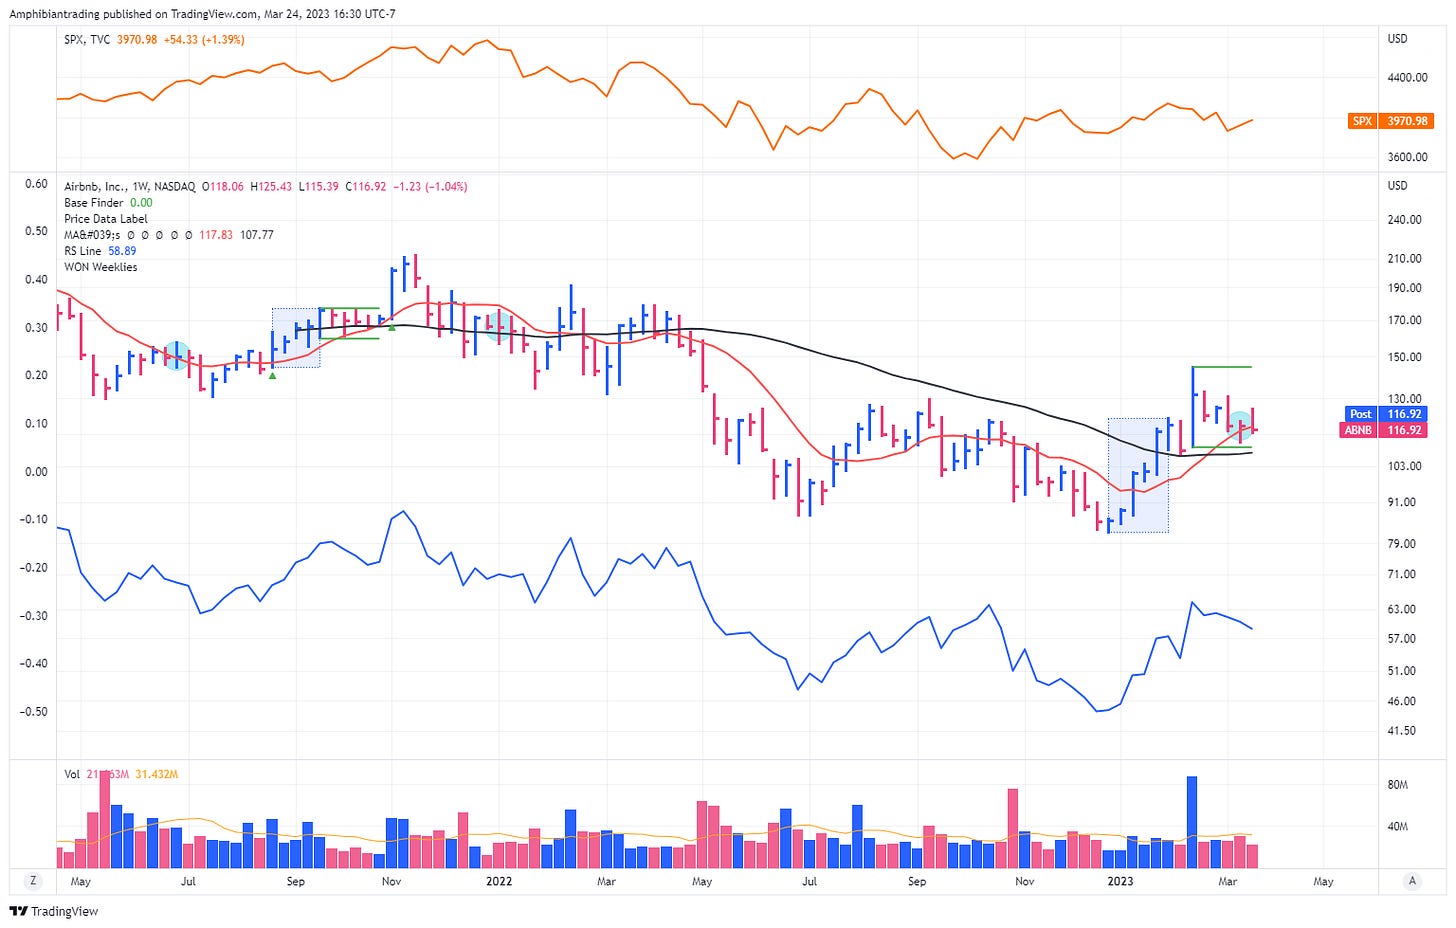
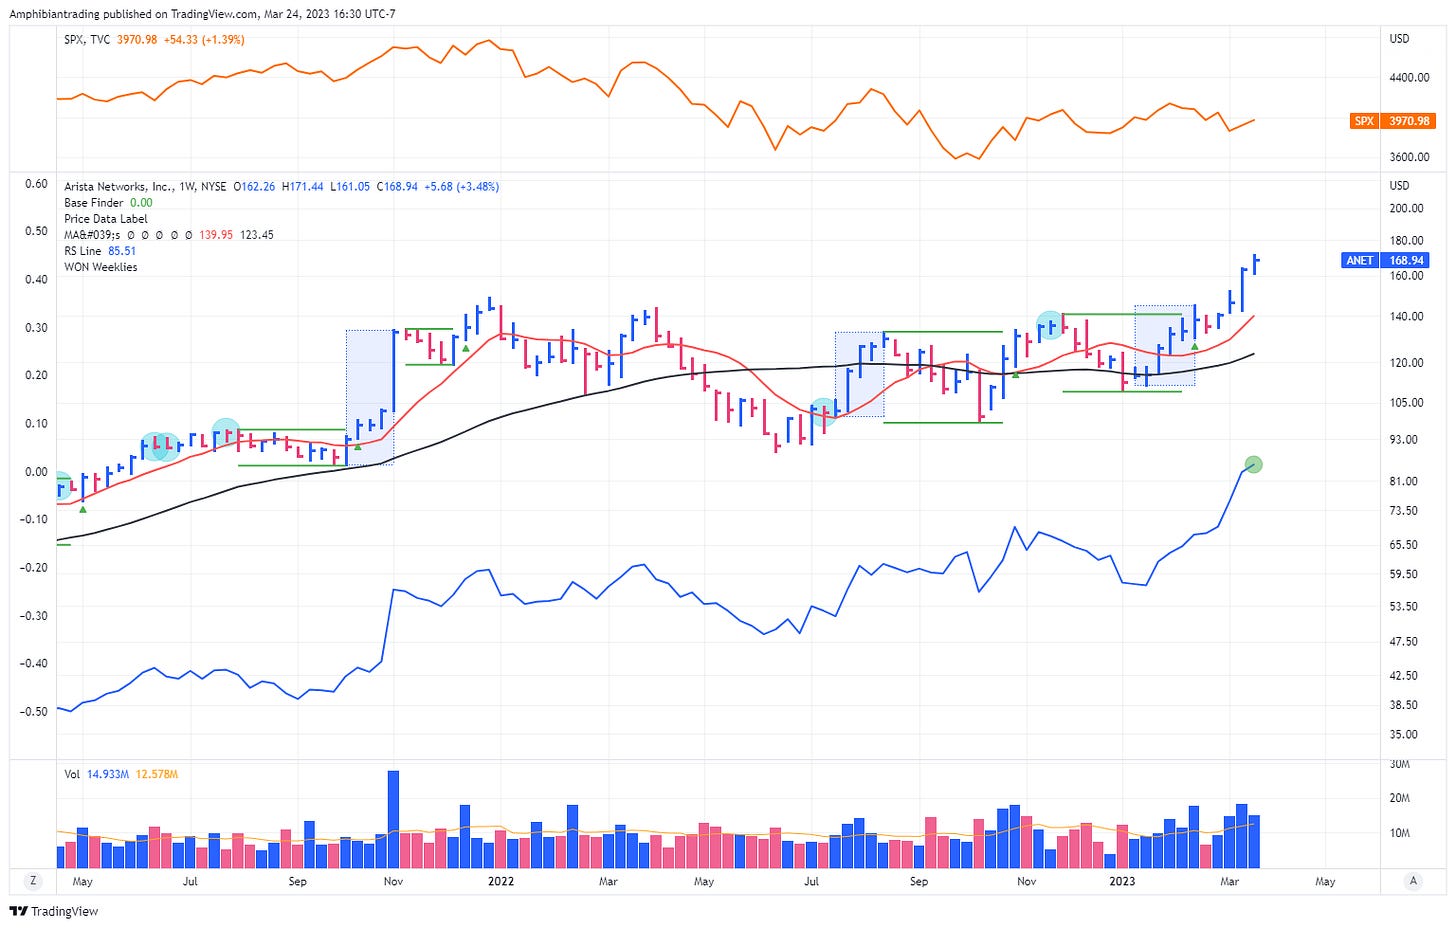
Many stocks put in constructive action this week with tight weekly closes after finding support at spots you would expect like the 10 week moving average. Here are 5 stocks I am watching and a link so you can get my full focus list.
ABNB is now 5 weeks into a new base on declining volume, with 3 tight weekly closes near the 10 week moving average.
Continues to be a market leader. Extended here and could use a breather, but showing no signs of slowing down.
Consolidating nicely above the 10 week moving average as volume continues to dry up.
Absolute strength blasting higher on earnings with the highest volume in the stocks history.
Briefly pushed above the Flat Base pivot before closing back inside the base. Support at the 10 week moving average and will need volume to come in on the reclaim of the pivot.
How to spot Relative Strength
Thanks for reading! If you enjoyed this article please help support my work by doing the following:
Follow me on Twitter @amphtrading
Share this post using the button below
The content presented is for informational and educational purposes only. Nothing contained in this newsletter should be construed as financial advice or a recommendation to buy or sell any security. Please do your own due diligence or contact a licensed financial advisor as participating in the financial markets involves risk.


