Plotting
Plotting is used to display information calculated using your script. There are multiple ways to plot in Pine Script from lines and shapes to tables and emojis.
Before we go into the different types of plotting, let’s revisit the annotation function from the top of our script. This is where you can determine the title of your code and where it actually plots on the chart, we’ll go over the main parameters you will use here.
Title
The name of your script
Short Title
This will change the title that is displayed on the chart, but not the name of your indicator in the script library.
Overlay
The overlay parameter is used to determine whether your indicator plots over price action or in a separate pane below. By default this is set to false, so if you want your indicator to plot over price action you will need to set this to true.
Plot
The Plot function is used to plot numbers onto a chart.
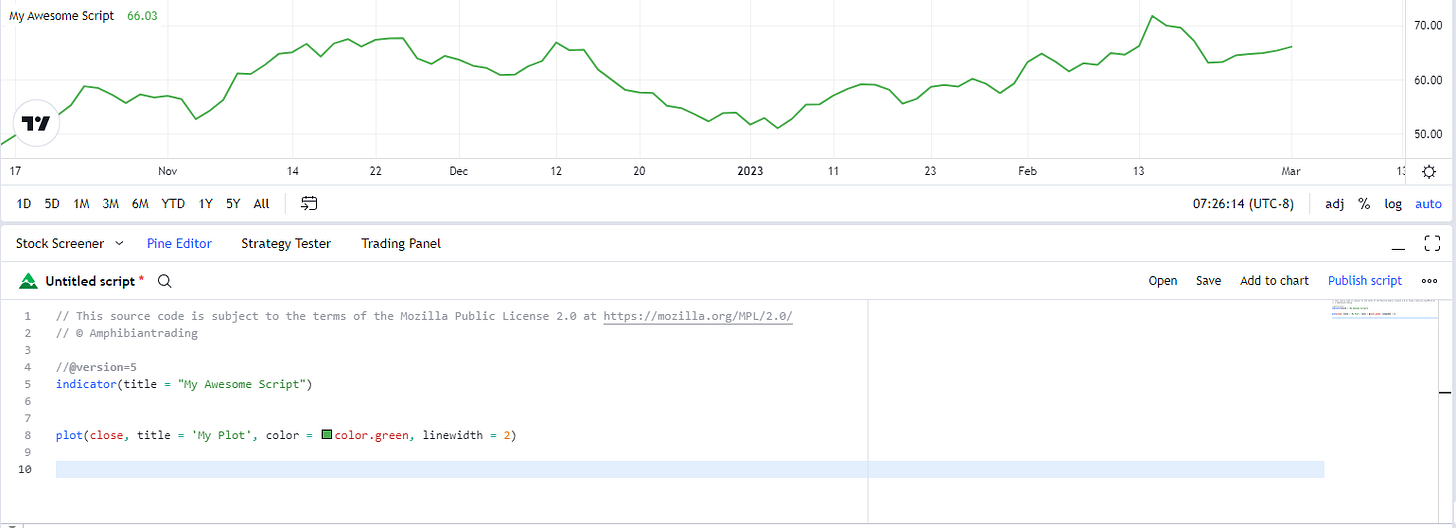
While you can customize the appearance of your plot using the parameters above, most commonly you will only need to use a few of these. The below example, plots the closing price, with a title of “My Plot”, with a color of green and a line width or thickness of 2 (1-5 are the options).
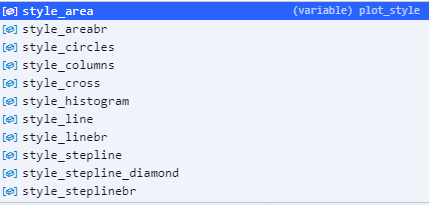
If you are plotting something like Volume however, you may want to learn the “style” parameter. Here are all the different options.
If you want to read more about the rest of the plot parameters you can do so here https://www.tradingview.com/pine-script-docs/en/v5/concepts/Plots.html
Plotshape
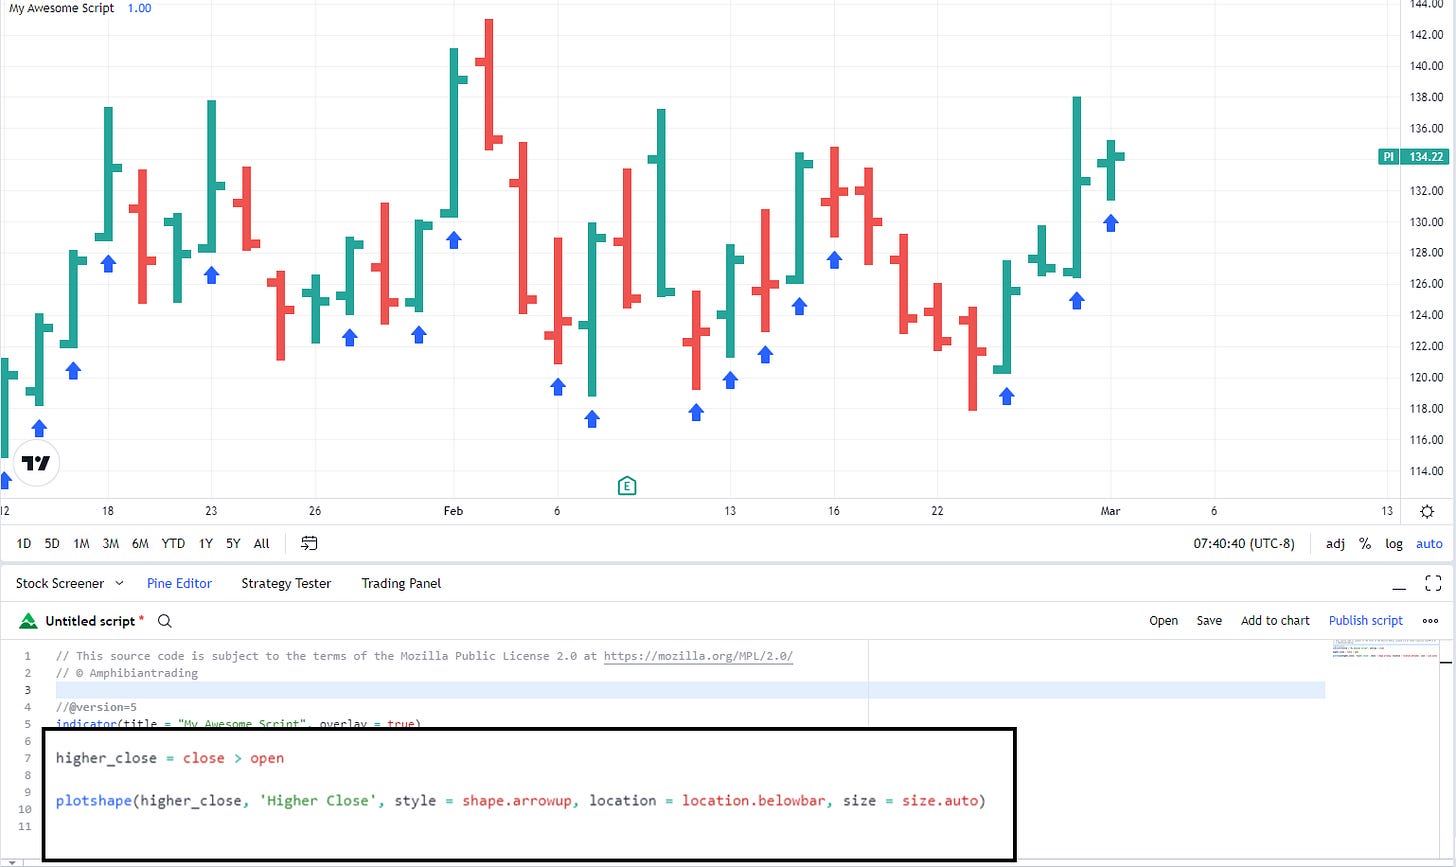
Plotshape is used to plot shapes onto the chart based on a Boolean value. In this example if the closing price is greater than the opening price, we will plot an arrow below the bar.
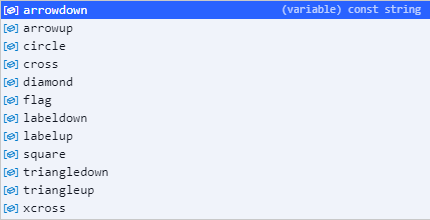
Similar to the first plot function, there are many different styles that you can chose from for the plotshape function. You will also want to become familiar with the different location and sizing options as well.


Besides the plot and plotshape functions covered here, there are also other ways to plot to your chart such as:
plotchar – plots a Unicode character instead of a shape, this can be an emoji
plotcandle – plots a candlestick
plotbar – plots a bar(no wicks)
plotarrow – plots an arrow
hline – plots a horizontal line
bgcolor – changes the background color if a condition is met
label.new – creates a label
line.new – creates a line
To learn more about each of these plots and the parameters they take, you can reference the official Pine Script documentation here:
At this point we have covered all of the basics of Pine Script and we’ll start breaking down different codes I have made and reviewing more complex elements in the near future.
Thanks for reading! I hope you found this lesson helpful. If you enjoyed this article please help support my work by doing the following:
Follow me on Twitter @amphtrading
Share this post using the button below
The content presented is for informational and educational purposes only. Nothing contained in this newsletter should be construed as financial advice or a recommendation to buy or sell any security. Please do your own due diligence or contact a licensed financial advisor as participating in the financial markets involves risk.


