


Reversal Bars
How to trade them & free indicator


Reversals, both upward and downward, show where major market participants believe a stock has gone too far and can often mark a change in trend. Even though they may not want to, large funds are forced to expose their hand through reversals.
It can be a warning sign to have a downside reversal, especially in a leader that has been outperforming the market for some time.
While similarly, if the price of a stock suddenly reverses to the upside, it could be a sign that institutional investors view it as a steal and are aggressively accumulating shares.
Let's review what defines a reversal bar per Investor’s Business Daily:
Upside Reversal:
Current bar undercuts previous bar
Price closes in the upper 60% of the range
Downside Reversal:
Current bar makes a high above previous bar
Price closes in the lower 60% of the range
Before we dive into examples and my free indicator make sure you are subscribed so that you don’t miss any future updates!
Now that we have a general understanding of what reversal bars are, let’s look at some specific examples to further illustrate this concept.

Let’s look at MOS back from the beginning of 2022.
MOS had formed a nice cup base and broken out into new highs.

The stock dropped quickly before forming an upside reversal right at its 10-week and 50-day moving averages. It is critical that the upside reversal occurs near a potential area of support, such as a moving average, previous pivot point, or an earnings gap high volume close or low. The purple label on the chart notes the upside reversal and shows the closing range for the day. A link for the indicator can be found below.

The upside reversal bar makes determining your entry and exit points simple. A move above the high would trigger an entry with a stop just below the day's low.

The next day MOS opens right at the 10-week moving average and inside the body of the upside reversal bar before pushing higher and triggering an entry.

Fast forward a few weeks and you are sitting with a healthy gain all while keeping your stop was never tested.


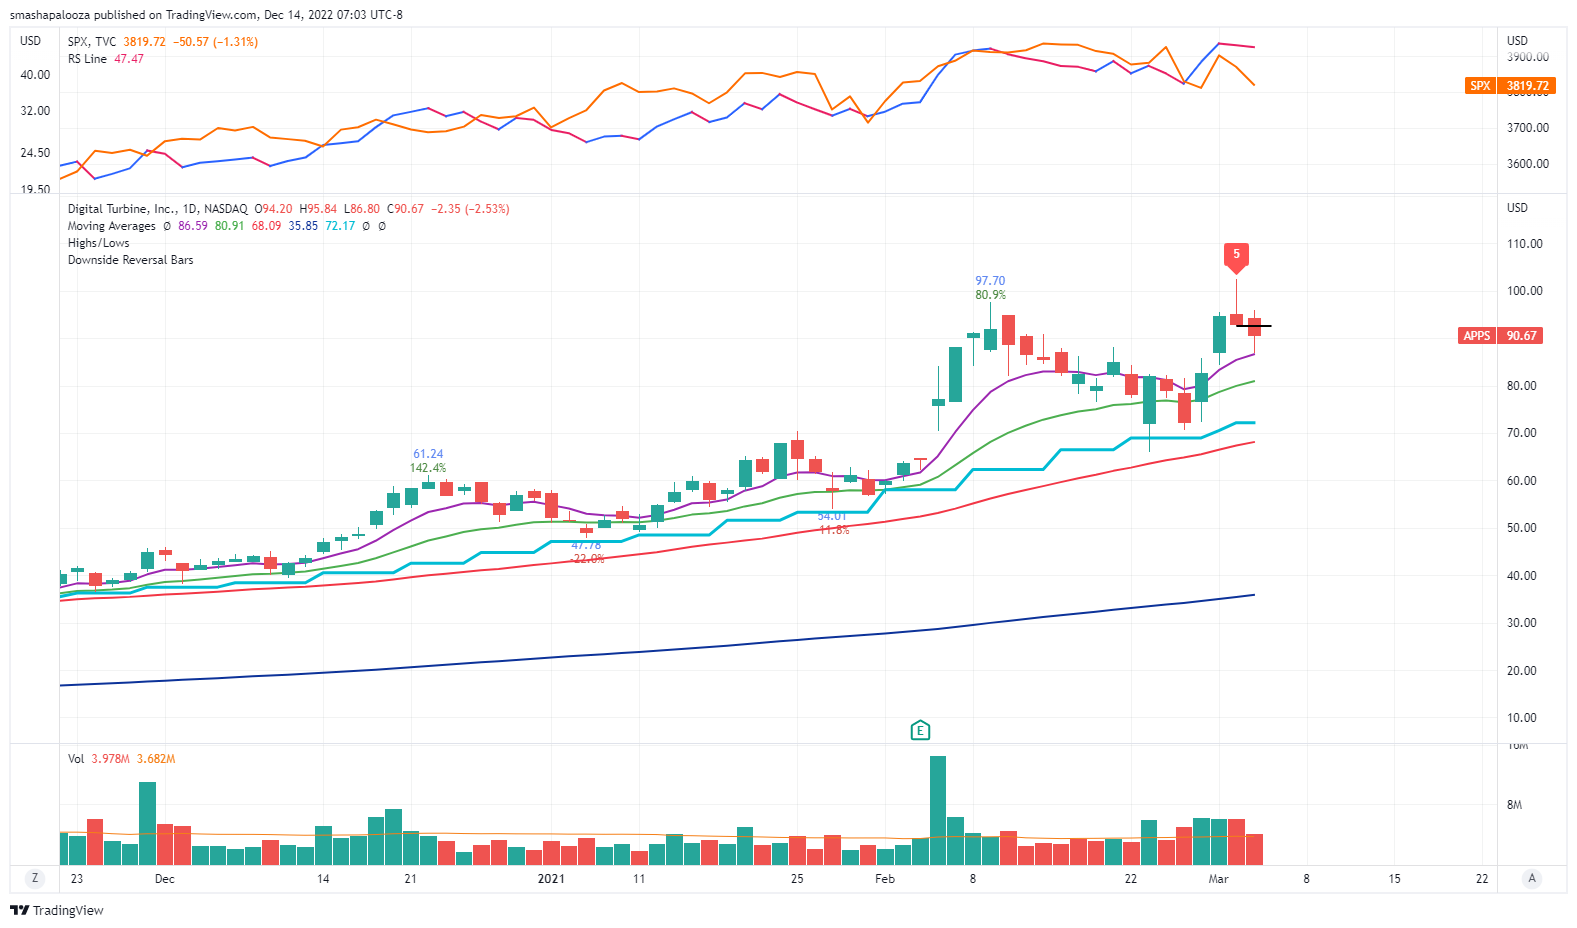
After looking at an example of an upside reversal, let's look at a downside reversal using APPS from March of 2021.
APPS had a very good run in 2020 and was one of the best stocks; however, in 2021, as many growth stocks began to peak, APPS failed right around the $100 Livermore level and staged a downside reversal. The red label on the chart notes the upside reversal and shows the closing range for the day. A link for the indicator can be found below.


On the downside reversal bar, price had become extended from its moving averages, and volume had increased. A break below the low of the downside reversal was our trigger to sell our existing shares or go short the stock if we thought it was topping.

The next day APPS opened in the body of the downside reversal bar before moving lower and triggering a sale.
Volume continued to increase as the stock sold off all the way back to its 50-day moving average.
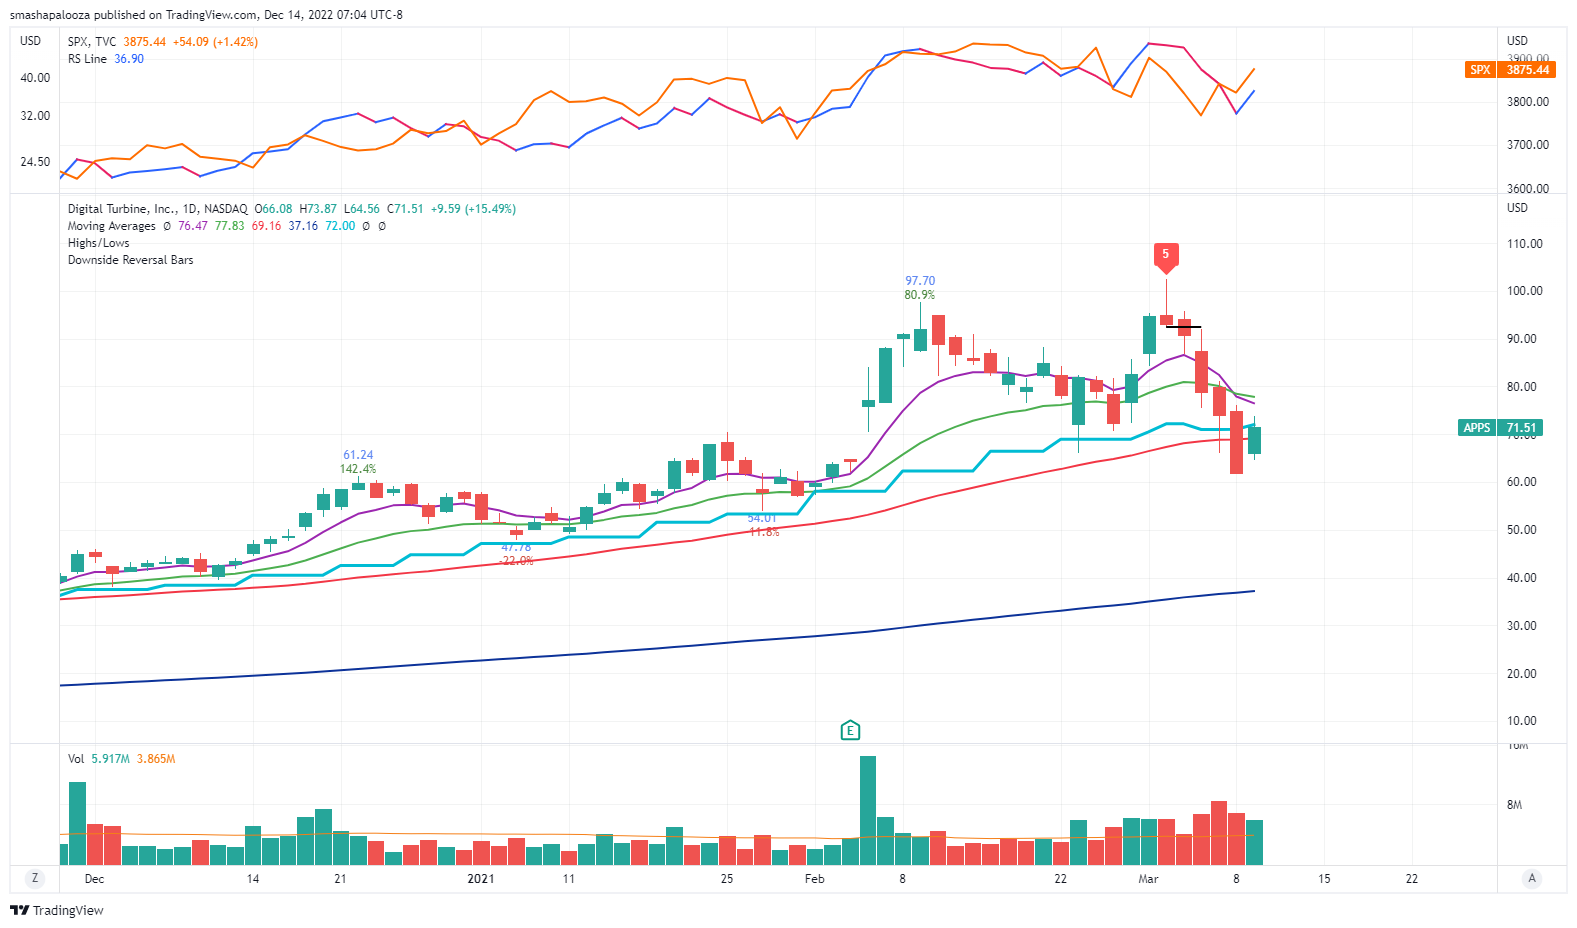
Fast forward and you can see selling at that downside reversal saved you from sitting through a near 50% decline and got you out just a few percent below the all time high.


Reversal bars are a powerful tool for traders to identify potential changes in the direction of a stocks trend. When used in conjunction with other technical analysis techniques, they can provide clues as to what institutions are doing with a stock and allow for low risk entry points or great spots to lock in profit.
To help make spotting reversal bars easy, I created an indicator for TradingView that will plot a label below an upside reversal and above a downside reversal that shows the closing range of the bar as shown in the examples.
You can add it to your charts by clicking the link below.
Thanks for reading! If you enjoyed this article please help support my work by doing the following:
Follow me on Twitter @amphtrading
Share this post using the button below
The content presented is for informational and educational purposes only. Nothing contained in this newsletter should be construed as financial advice or a recommendation to buy or sell any security. Please do your own due diligence or contact a licensed financial advisor as participating in the financial markets involves risk.