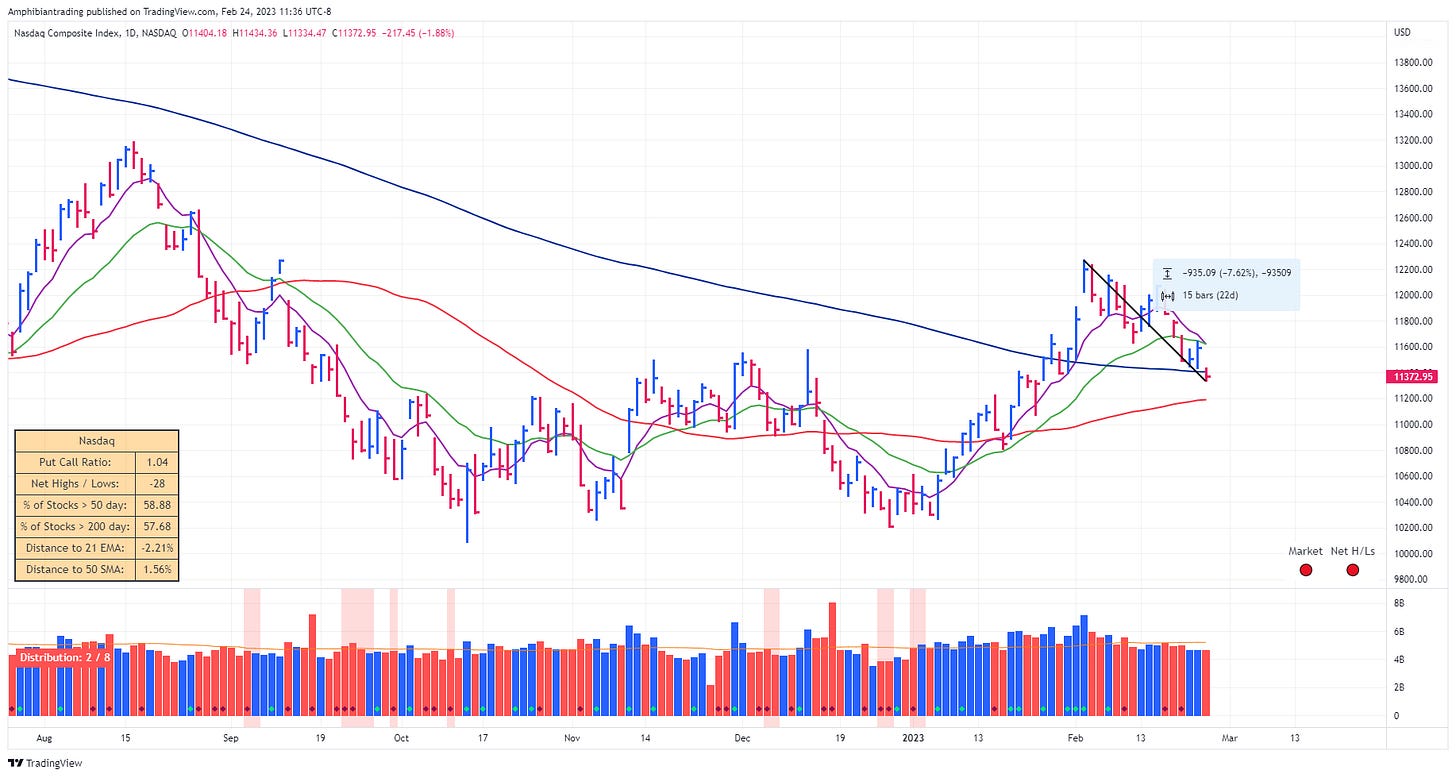
The Nasdaq has been experiencing a rough few weeks, falling about 7.5% since the start of the month. While individual stocks have been hit harder, it is not surprising that the Nasdaq has returned to its 200-day moving average. Since the start of the bear market, the index has not been above or even touched the 200-day moving average until last month. It seemed unlikely that the Nasdaq would just break through it the first time and not even retest the 200-day.
Before we dive into my full market analysis make sure you are subscribed so that you don’t miss any future updates!
Looking at the fibs from the low to high of the latest rally. The 50% retracement level is right below us, and the 50-day moving average should be at about the same price early next week. This level also lines up well with the two peaks from October. If the bulls are going to make a stand, we should expect to see it around this area.
There are also still potential risks for the market. First, the dollar is continuing its uptrend since the start of February. All of the shorter moving averages are bullishly stacked, which is not what equity bulls want to see. This could potentially run into resistance at its 200-day moving average above.
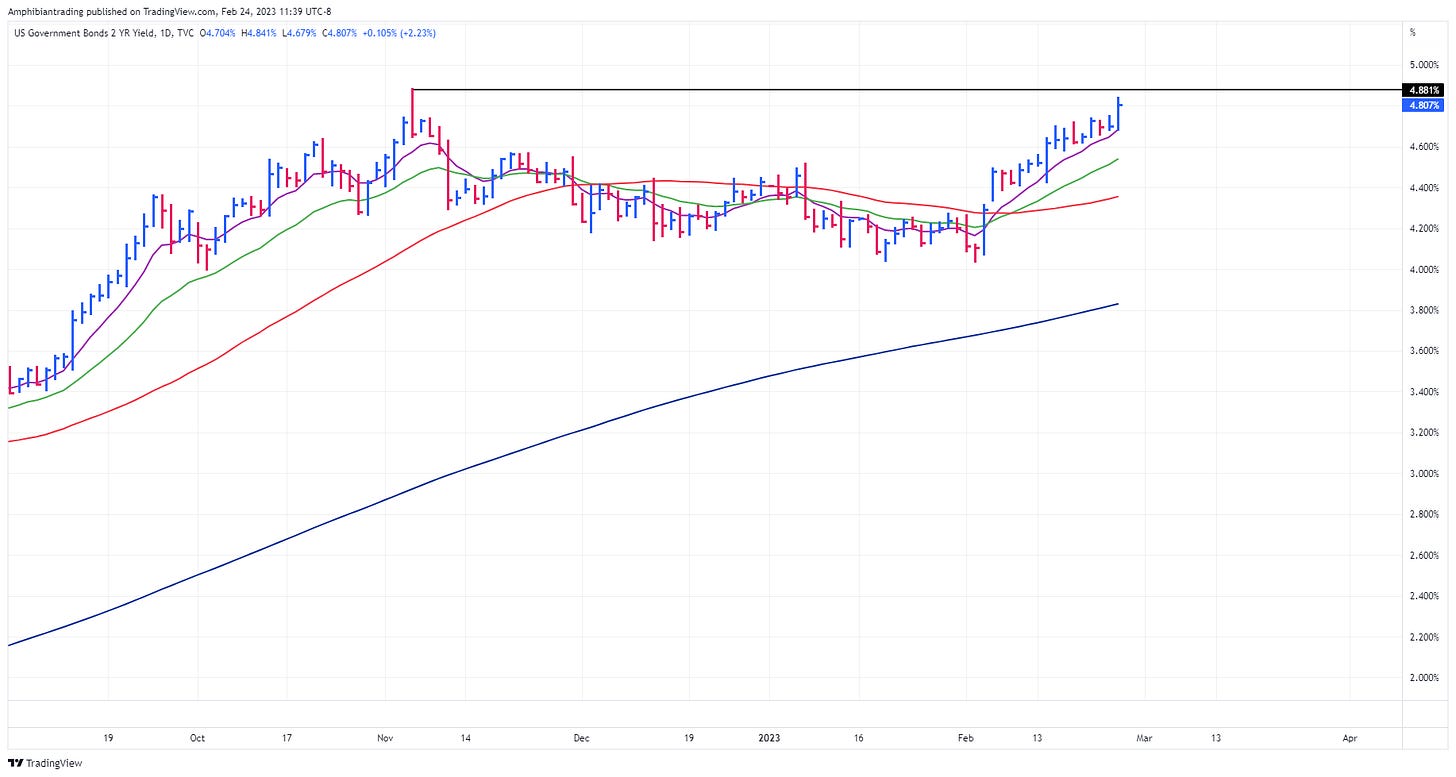
Next, the 2-year yield is right near its highs from November, with all of its moving averages bullishly stacked as well. One positive divergence here is the price of the Nasdaq, which is much higher than it was back in November when the 2-year made a high. We'll have to wait and see how that plays out.
The 10-year yield also looks set for higher prices. Something that sticks out to me here is this perfect double bottom base, if this was on a stock I would be all over it. The moving averages here are also stacked bullishly, so unless something changes or we start getting some favorable data, it does look like it wants to go higher.
Finally, the VIX is starting to show higher highs and higher lows and is also starting to see its moving averages align bullishly.
Overall, there are some definite headwinds for the markets, but there is that key area as well as the 200-day moving average that bulls will be watching for. It remains to be seen whether the bulls will make a stand or the market continues to fall.
To see how previous bear markets (1990’s, 2000, 2008) price action reacts around the 200 day moving average watch the video below, where I walk through each one.
Thanks for reading! If you enjoyed this article please help support my work by doing the following:
Follow me on Twitter @amphtrading
Share this post using the button below
The content presented is for informational and educational purposes only. Nothing contained in this newsletter should be construed as financial advice or a recommendation to buy or sell any security. Please do your own due diligence or contact a licensed financial advisor as participating in the financial markets involves risk.


