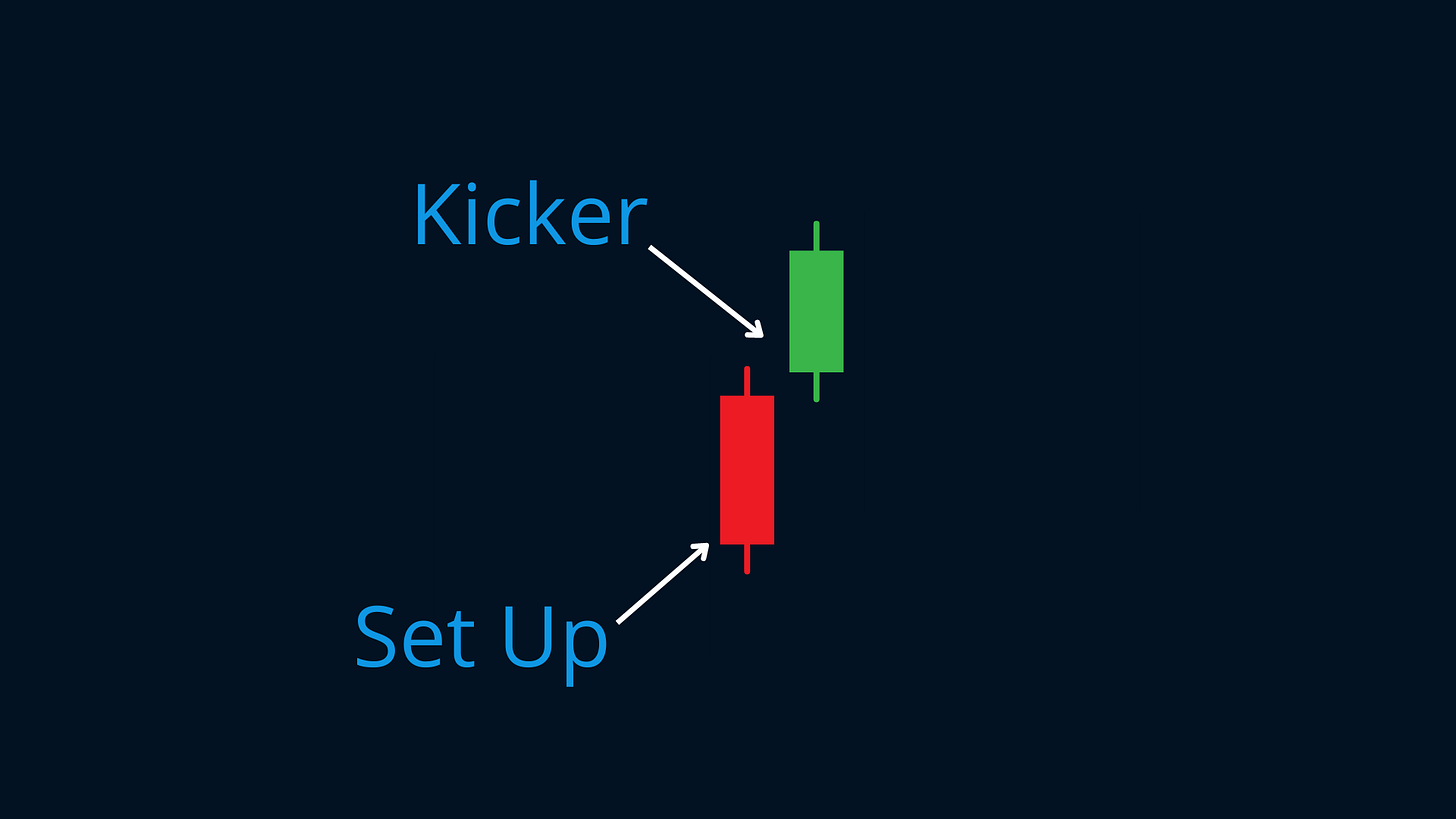
A Kicker pattern is a two-bar candlestick pattern used to identify a possible change in trend of a stocks price. There are two types of Kickers, bullish or bearish.
The general pattern of a Kicker is fairly easy to identify, but the context of which it is used is what makes the difference.
Let’s review candlestick basics before we get into the details of the Kicker pattern.
Before we dive into the Kicker Pattern, make sure you are subscribed so that you don’t miss any future updates!
Identifying a Kicker candle?
Since a Kicker is a two-bar combo, we’ll need to first look for the “set up” bar. This is a red candlestick, a candlestick where the close is lower than the opening price. This red candle “sets up” the possibility of a kicker pattern forming.
To complete the Kicker pattern, the next bar needs to gap up above the opening price of the “set up” candle.
Stop loss for this pattern?
A Kicker pattern fails if the Kicker candle falls back to the close of the “set up” bar. That would signify that buyers are no longer in control.
When to use a Kicker Pattern?
While Kickers can show up at any time on a chart, it is imperative that you use a Kicker pattern at the right time.
For a bullish Kicker pattern, you need strong stock preferably in a leading group that is showing Relative Strength while forming a proper basing structure.
Let’s look at EQT 0.00%↑ in the beginning of August. EQT 0.00%↑ formed a nice Cup with Handle base, where the handle drifted down on light volume towards the 21ema and 50sma. EQT 0.00%↑ formed a Kicker pattern with the “set up” bar on August 8th and the Kicker on August 9th indicated by the blue arrow on the chart. (TradingView Indicator below)
The total risk on this trade was about 2.75% (buying the Kicker gap up with a stop loss at the previous days close) and a few days later on August 22nd you were sitting with over a 16.5% or 6:1 gain.
TradingView Indicator
The Kicker pattern when used correctly in the right context is a very powerful entry tactic that can provide some of the best risk to reward trades out there. If you’d like help identifying Kickers quickly and easily you can use my TradingView indicator linked below. This will plot an arrow under any Kicker candle on the chart as seen in the EQT 0.00%↑ examples above.
https://www.tradingview.com/script/bNVZT3lw-Bullish-Kicker/
Video
Thanks for reading! If you enjoyed this article please help support my work by doing the following:
Follow me on Twitter @amphtrading
Share this post using the button below
The content presented is for informational and educational purposes only. Nothing contained in this newsletter should be construed as financial advice or a recommendation to buy or sell any security. Please do your own due diligence or contact a licensed financial advisor as participating in the financial markets involves risk.


