The Market:
What a difference a week makes. Coming into this week things were not looking good, we had taken out the lows from both June as well as the follow through day and we were rejected at those same levels from the underside on Friday’s attempted bounce. Fast forward to today and this market has done a complete 180.
So what happened? Thursday’s CPI report came in lower than expected on all measures and not only did the numbers come in lower than the forecast, but they came in well below forecasts. Look at core CPI month over month and this month it came in at .3% which is half of what it came in at last month at .6%, that is a very significant decline.
This means what the FED is doing by raising interest rates and quantitative tightening is starting to work and make its way into the economy. To the market that means peak inflation and peak financial tightness could be a thing of the past.
As soon as the CPI data was released Thursday morning futures rallied like a bat out of hell and we were off to the races. The Nasdaq had its largest ever one day point gain while also notching another follow through day, pushing back through the 50 day moving average, having the low of the day above the 21 exponential moving average and flipping back to net new highs.
Friday the market added to these gains as we continued to push closing near the highs for the week. The question is where do we go from here. A couple day to digest recent gains would be constructive and allow moving averages to catch up to price. One thing we will want to watch for clues is the Dollar.
Looking at the chart of the dollar, we have a series of lower highs and lower lows confirming the weakness we’ve been seeing here. If the dollar remains weak, it should bode well for stocks and a drop to the 200 day moving average which also lines up pretty closely to the lows in August seems like a magnet.
Secondary Indicators:
Put Call Ratio: Neutral reading at 0.75
Percent of Stocks above the 50 day: Nasdaq - 71% S&P – 81%
Percent of Stock above the 200 day: Nasdaq - 45% S&P - 52%
Looking Ahead to Next Week:
After a blockbuster CPI report this week next week might seem tame; However, there are still some key reports we need to pay attention to, specifically the PPI report Tuesday, Retail Sales Wednesday, and existing home sales on Friday.
Before we dive into my current portfolio and actionable ideas, make sure you are subscribed so that you don’t miss any future updates!
Current Portfolio:
(Avg. Price, 1st Purchase Date, Stop Loss)
ALB 0.00%↑ (310.29, 11/10/22, 304.25)
ALB broke out of an 8 week 25% deep cup base Tuesday with big volume. While breakouts haven’t been working, and knowing CPI data was coming Thursday I planned on watching this for a failed breakout pullback. Wednesday set up a potential Kicker pattern and was also an inside day. When the market began rallying on the CPI release I opted to initiate the position with a Kicker right at Thursdays open. Friday’s action was positive as well, although we did stall and see some profit taking at new highs. A pullback from here would be expected, ideally it will happen on light volume and drift more sideways rather than a fast drop.
Free Kicker Indicator - https://www.tradingview.com/script/bNVZT3lw-Bullish-Kicker/ - Plots a blue arrow under a Kicker candle as seen in chart above.
LULU 0.00%↑ (343.40, 11/10/22, 328.26)
LULU broke out of a well defined 8 week 22% deep cup with handle base bottoming base. After hitting a low in May LULU rallied 41% before forming a proper base. There was also a very well defined multitouch trendline coming down from the left side high of the cup to the highs of the handle. I initiated this on Thursday morning as well as price gapped above both the trendline and cup with handle pivot point.
ON 0.00%↑ (68.82, 11/10/22, 67.85)
ON pushed past a multi touch trendline inside of a 12 week 23% deep base. ON had been showing relative strength as it remained close to all time highs while the market had been selling off. This formed a very nice trendline and pushed through with a nice surge in volume on Thursday while also reclaiming both the 10 week and 50 day moving averages.
Actions taken:
Bought: ALB, ENPH, LULU, ON
Sold: ENPH – Stop Loss
Potential Leaders:
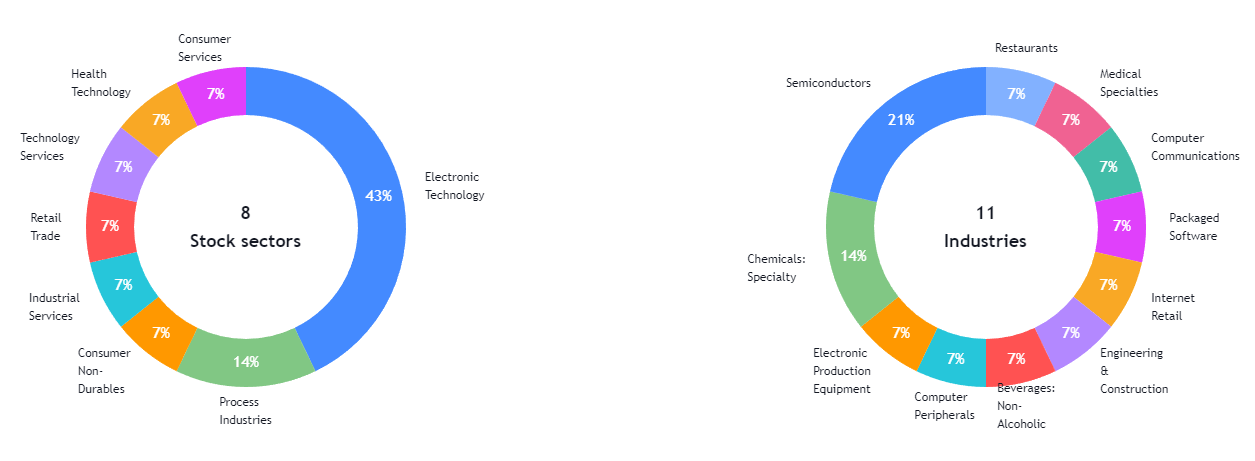
AEHR, ALB, ANET, CELH, DY, ENPH, LULU, MBLY, ON, PI, SMCI, TMDX, WING,
Additions: ALB, ANET, LULU, LTHM, MBLY, ON, TMDX
Removed: GPK, SWAV
https://www.tradingview.com/watchlists/84325802/
Actionable Ideas:
Stocks listed in the actionable buys are stocks with strong fundamentals and showing good technical action that can offer a low-risk entry. Not every entry will trigger, but also just because a stock is listed here does trigger does not mean I will take the trade. Portfolio exposure, market health and other factors will also be considered.
ENPH 0.00%↑ – Cup with Handle - $316.87
ENPH attempted to breakout of it’s cup with handle base on Friday, but ultimately failed and closed lower with a very poor showing. The weekly structure however is still in tact and news of this being added to the Nasdaq 100 could provide a spark to reclaim the pivot.
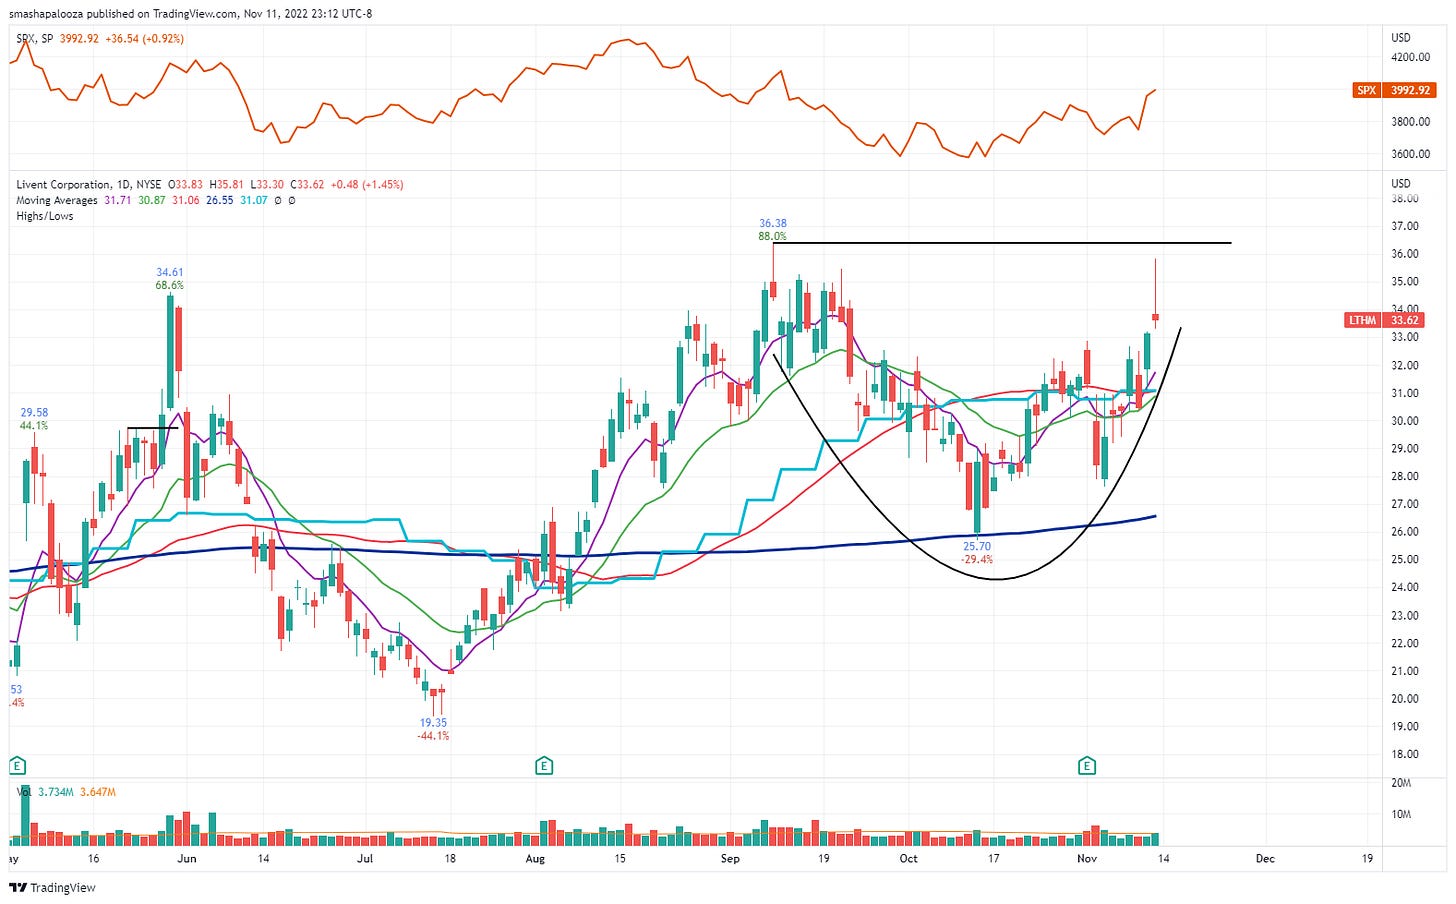
LTHM 0.00%↑ – Cup - $36.38
LTHM is forming a nice cup base. It could go onto form a handle or attempt to breakout without one. A push above the left side high with heavy volume would be buyable, but I would prefer a few days of consolidation to form a handle and allow moving averages to catch up. If this were to breakout on Monday I would personally pass and wait for a pullback entry as it seems short term extended.
MBLY 0.00%↑ – IPO Base - $29.86
MBLY is a recent IPO that has just formed its first base. While Friday it did close above the breakout level it is still right in buy range just 9 cents above the pivot.
TMDX 0.00%↑ – Failed breakout pullback - ~ $52.50
TMDX formed a nice cup base and then broke out with a powerful earnings gap up. A pullback to the 21 ema at some point next week could be worth a shot as a nice low risk entry. A word of caution with this one however is the company is not profitable – those have been hurt the most in this bear market, but it does have triple digit sales growth and a very nice volume profile making it attractive.
Thanks for reading! If you enjoyed this article please help support my work by doing the following:
Follow me on Twitter @amphtrading
Share this post using the button below
The content presented is for informational and educational purposes only. Nothing contained in this newsletter should be construed as financial advice or a recommendation to buy or sell any security. Please do your own due diligence or contact a licensed financial advisor as participating in the financial markets involves risk.


