The Market:
The seasonally worst month of the year ended just how you would expect it to with the indexes closing right at lows, down 10.5% for the month. Tough talk from the Fed and hot economic data including GDP, CPE and consumer spending fueled the fire for the bears. With the Fed trying to fight inflation by raising rates, demand destruction and a recession seems likely, however the data isn’t suggesting that we are there yet giving the Fed more leeway to keep increasing rates aggressively. While bearish sentiment is extreme, it is warranted from the action in the indexes, individual stocks, and the macro backdrop. For the first time in history the AAII investor sentiment survey showed the bears at over 60% for two consecutive weeks. Last week we saw the holdout stock starting to get hit, and while they held up much better than the market this week they failed to rally back and seem to be setting up bear flags on low volume showing a lack of buyers.
On a positive note, despite the market hitting new lows for the year on Friday, the 2-year yield and dollar did not make new highs. Also the number of net lows has been decreasing and is not as high as when the market hit new lows in June.
Secondary Indicators:
Put Call Ratio: Neutral reading, almost bullish at 1.12
Percent of Stocks above the 50 day: Nasdaq - 9% S&P – 3%
Percent of Stock above the 200 day: Nasdaq - 16% S&P - 11%
Looking Ahead to Next Week:
Next week promises to be another volatile one, as we get a very important Nonfarm payrolls and unemployment rate number on Friday. If the unemployment rate rises it could speed along the demand destruction the Fed is trying to create, which would ultimately give the Fed a reason to pause rate hikes. Unfortunately at this time we want bad news, which can be seen as good news for the market.
Before we dive into my current portfolio and actionable ideas, make sure you are subscribed so that you don’t miss any future updates!
Current Portfolio:
(Avg. Price, 1st Purchase Date, Stop Loss)
ENPH 0.00%↑ ($261.49, 7/27/22, Breakeven)
ENPH had another low volume week as it continues to consolidate. A tight weekly close is a positive, however price is below the 50 day and 10 week moving averages as the daily chart is forming a bear flag. This will need to push higher next week or at least not breakdown to counter the bear flag.
TTD 0.00%↑ ($61.09, 9/28/22, $58.75)
TTD is forming a possible double bottom base. I initiated a position on Wednesday as the stock reclaimed the 10 week moving average. On twitter this week I laid out a detailed plan on possible scenarios for this stock. For now, the double bottom base is what I am looking for, we will see if this morphs into something else.


Actions taken:
Bought: $TTD
Sold:
Potential Leaders:
CELH, DV, ENPH, LPLA, PCTY, SWAV, TSLA, TTD, WOLF, WSC
Additions: None
Removed: None
https://www.tradingview.com/watchlists/84325802/
Actionable Ideas:
Stocks listed in the actionable buys are stocks with strong fundamentals and showing good technical action that can offer a low-risk entry. Not every entry will trigger, but also just because a stock is listed here does trigger does not mean I will take the trade. Portfolio exposure, market health and other factors will also be considered.
While the overall health of the market is very weak and bearish sentiment is extreme, there are some stocks that are showing tremendous relative strength and have the potential to be bought if the market wants to have a relief rally.
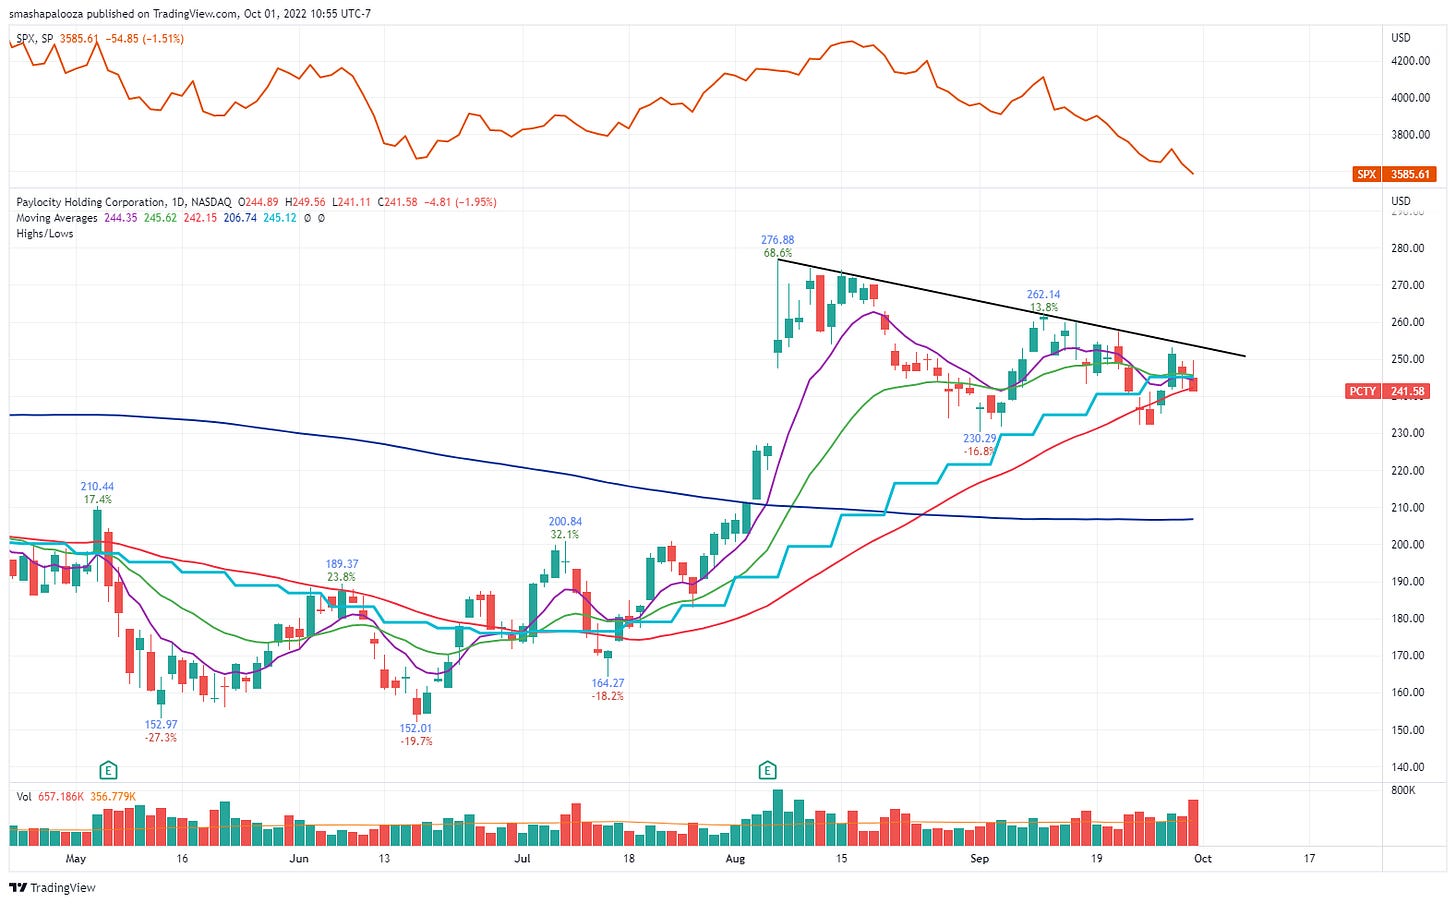
PCTY 0.00%↑ – Multitouch Trendline – ~ $253ish
PCTY has been holding up tremendously well in this hostile market. While the markets have gone on to make new yearly lows PCTY has not undercut the low it make on September 1st as it bases after a monster earnings gap up in August. Ideally this would undercut the September low and form a proper double bottom base, however if this doesn’t happen there is a very nice multitouch trendline that could provide an actionable entry. My stop would be below the day before price pushes through the trendline.
TSLA 0.00%↑ – Shakeout + 10% – $292.30
TSLA had a nice uptrend and is now 7 week into what appears to be a double bottom base. The depth of the base is only 16% which is extremely shallow considering the market has dropped nearly the same amount and TSLA has almost a beta of 2. A shakeout plus 10% entry would correspond with TSLA also getting back above all of its moving averages. I would use a simple 5% stop maximum on this trade.
TTD 0.00%↑ – Mini Coil - $63.28
TTD is forming a new base after a very strong earnings gap up in August. A mini coil has now formed by having two bars inside of last Wednesdays bar. The entry would coincide with reclaiming the 200 day moving average. With a maximum stop below Fridays low.
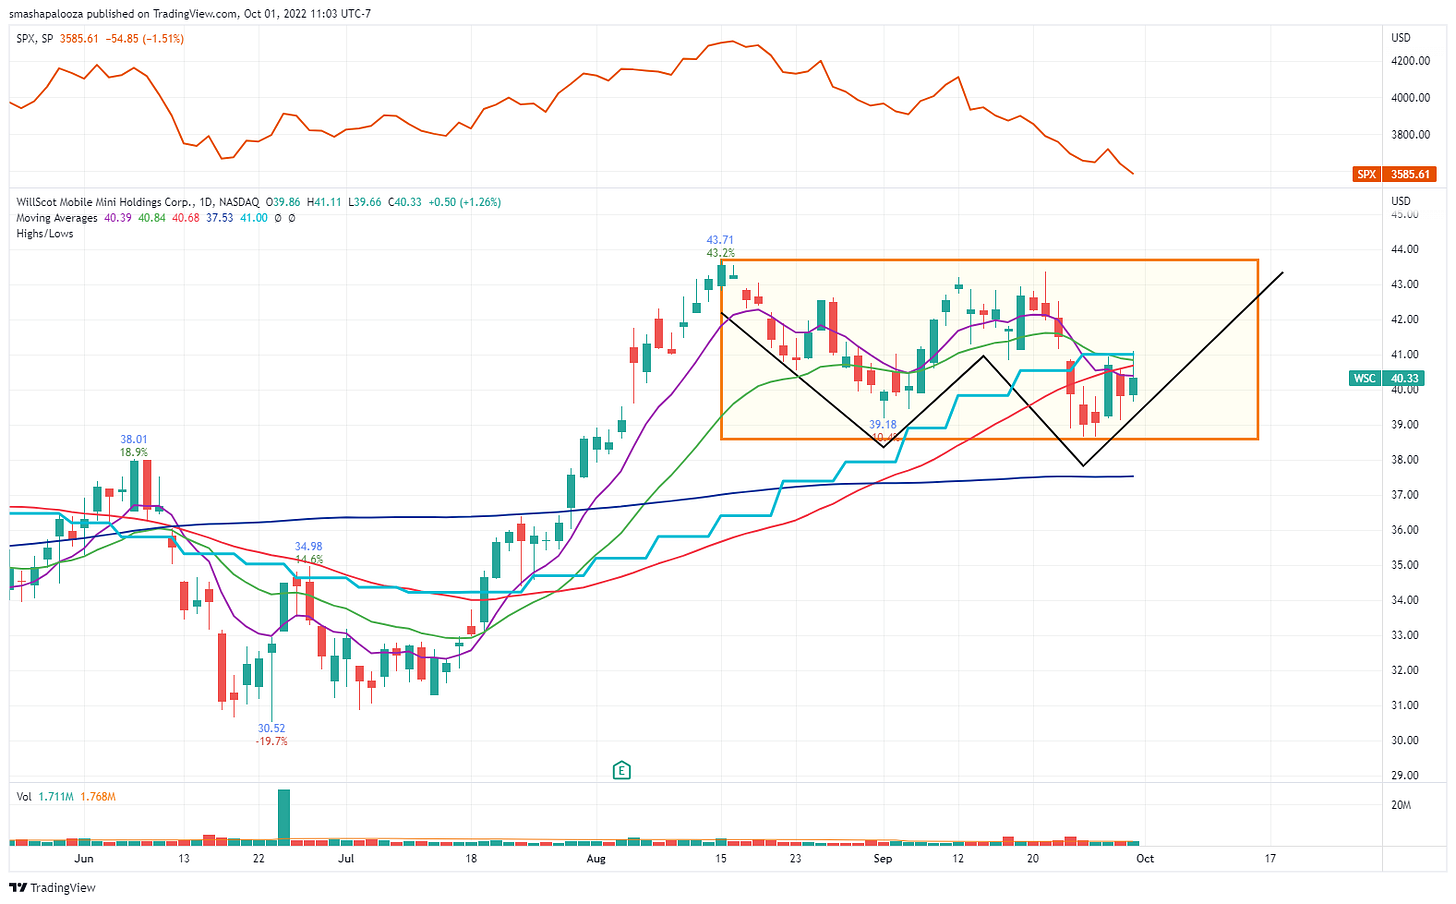
WSC 0.00%↑ – Flat Base / Double Bottom Base - $43.09
WSC continues to hit relative strength new high after new high. This is now 7 weeks into a flat base that also has the shape of a double bottom base within it. I would be looking to use a shakeout plus 10% entry if this can rally to the $43.09 level and get back above all of it’s moving averages.
Thanks for reading! If you enjoyed this article please help support my work by doing the following:
Follow me on Twitter @smashapalooza16
Share this post using the button below
The content presented is for informational and educational purposes only. Nothing contained in this newsletter should be construed as financial advice or a recommendation to buy or sell any security. Please do your own due diligence or contact a licensed financial advisor as participating in the financial markets involves risk.


