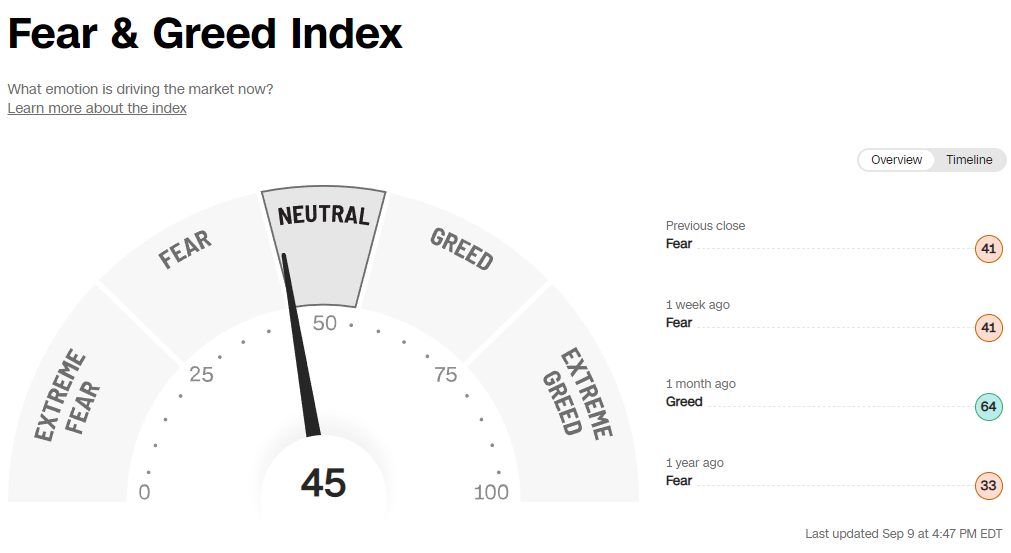
The Market:
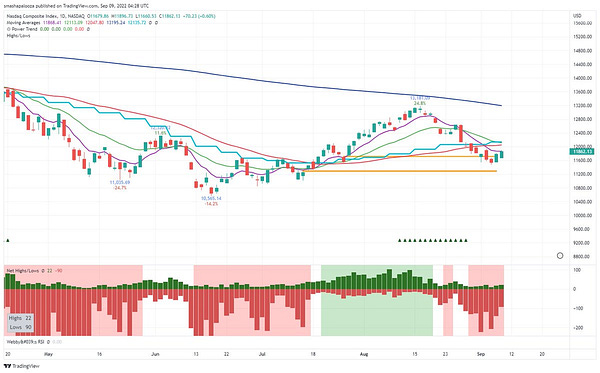
While the market had a shortened week due to Monday’s holiday, the Nasdaq made up for it with strong gains, ending the week up over 4%. Weakness in the dollar helped lift stocks and follow through day like action occurred on Friday with both the Nasdaq and the S&P reclaiming their 50 day moving averages. The S&P also reclaimed its 21ema, while the Nasdaq closed right on it.
To add to the strength of the market, the net new highs and lows significantly improved. As I pointed out on Twitter during the week it was encouraging to see the number of net new lows decrease while the number of net new highs was increasing. This continued to happen and on Friday the NYSE was able to get it’s first day of net new highs since the latest leg down started. The Nasdaq fell just short ending the day with net lows edging out net highs by 2, but none the less the trend of decreasing lows and increasing highs is welcome.


Here’s a zoomed in look at the net new highs and lows on the Nasdaq. Notice how the net highs in green has been gradually increasing the last few days as the net new lows in red have been shrinking.
Secondary Indicators:
Put Call Ratio: Neutral reading at 0.95
Percent of Stocks above the 50 day: Nasdaq - 52% S&P - 63%
Percent of Stock above the 200 day: Nasdaq - 32% S&P - 37%
Looking Ahead to Next Week:
Next week is jammed with economic releases, the most likely to have an impact on the market being Tuesday’s CPI data. Tuesday’s release could very well determine if the market can sustain a new rally attempt or start a new leg down.
Before we dive into my current portfolio and actionable ideas, make sure you are subscribed so that you don’t miss any future updates!
Current Portfolio:
ARRY finished the week slightly positive as it continues to build the flag of it’s high tight flag base. On a daily chart there is a nice coil forming and the Bollinger bands are within a 1 ATR Keltner channel signifying price expansion should be coming soon.
CELH had a successful test of the 10 week moving average, and closed well off the lows with an 88% weekly closing range. If the market can rally from here this should be one of the top stocks and first back to new highs.
ENPH was the star of the week breaking out of a square box base on massive volume hitting new all time highs. While Friday there was an analyst downgrade that hit the stock, it quickly recovered and closed strong just below the base pivot. This is the current TML.
WOLF continues to consolidate after running up 9 weeks in row. This closed the week slightly above the close of it’s massive earnings gap up from 3 weeks ago. While the market sold off sharply last week, this didn’t even trade down to its 21 ema.
Actions taken:
Bought: ARRY, WOLF
Sold:
Potential Leaders:
ARRY, CELH, CMG, DV, DVN, ENPH, EQT, ESTC, GLNG, LNG, LNTH, LPLA, NFE, ON, OXY, PCTY, PI, PRVA, SWAV, WOLF
https://www.tradingview.com/watchlists/84325802/
Actionable Ideas:
ARRY 0.00%↑ Coil / Trend Line - $22.41
ARRY continues to coil and has formed a nice multitouch trendline. Breaking back above the last touch of $22.31 is actionable.
ENPH 0.00%↑ Failed Breakout Pullback - ~ $292.50
ENPH broke out to new all time highs this week and can now be a candidate for a failed breakout pullback to the 21ema.
SWAV 0.00%↑ - 10 Week Pullback - ~ 261.50
SWAV has been one of the leaders of this current uptrend. After a strong earnings gap and pushing to new highs, the 10 week line is finally above the previous highs and I will be looking to initiate a position on a touch of it.
References
Thanks for reading! If you enjoyed this article please help support my work by doing the following:
Follow me on Twitter @smashapalooza16
Share this post using the button below
The content presented is for informational and educational purposes only. Nothing contained in this newsletter should be construed as financial advice or a recommendation to buy or sell any security. Please do your own due diligence or contact a licensed financial advisor as participating in the financial markets involves risk.


I think what might be helpful is posting entry/exit dates, prices and percent gain/loss on each of your portfolio positions. I was going back through your market updates and it was a little difficult to figure that out.