The Market:
The Nasdaq continued falling this week with a 5.5% loss closing near the lows. The week started off strong with the Nasdaq and the S&P both gapping up with the lows being over the 21 ema and pushing up from their 50-day lines. The narrative that inflation had begun to peak was crushed on Tuesday when the CPI report came in hotter than expected causing the markets to have the worst day of the year, down over 5% on the Nasdaq and 4% on the S&P. A weak bounce back on Wednesday was met with more heavy selling on Thursday and Friday. All in all the general markets were extremely weak and seems poised for a retest of the lows, or at the very least to fill the gap from July 15th (orange box).
If you had just looked at the indexes or read what I described above, you would expect to see growth stocks being down much more than that. You would never imagine that there are stocks closing at new all-time highs. This is the importance of Relative Strength. While the indexes rolled over and we did have a negative trend of net new lows, leading stocks such as ENPH SWAV WOLF paint a much different picture. We will cover them in much more detail later, but from this Relative Strength is where the next group of true market leading stocks will come from and it is imperative that you are able to spot them. You can read my article below on different ways stocks exhibit Relative Strength and how to identify these potential leaders.
Secondary Indicators:
Put Call Ratio: Neutral reading, almost bullish at 1.14
Percent of Stocks above the 50 day: Nasdaq - 30% S&P - 24%
Percent of Stock above the 200 day: Nasdaq - 27% S&P - 25%
Looking Ahead to Next Week:
Next week is a big one, Jerome Powell and the FED will issue its latest statement and more than likely raise rates by at least .75 basis points. What Powell says in his press conference after setting interest rates will likely sway the market one way or the other. You can keep track of interest rate odds here.
https://www.cmegroup.com/trading/interest-rates/countdown-to-fomc.html
Before we dive into my current portfolio and actionable ideas, make sure you are subscribed so that you don’t miss any future updates!
Current Portfolio:
(Avg. Price, 1st Purchase Date, Stop Loss)
CELH 0.00%↑ ($84.01, 7/5/22, Breakeven)
CELH had another successful test of the 10 week moving average on below average volume as it continues to consolidate it’s recent run up from the lows. This is now 3 weeks into a potential new base forming and is holding up very well compared to the market.
ENPH 0.00%↑ ($261.49, 7/27/22, Breakeven)
ENPH managed a new all-time closing high on increasing volume, despite the market falling over 5% for the week. This is the current market leader, the #1 stock in the #1 solar group. If the market can find any footing, this has potential to be a monster.
ESTC 0.00%↑ ($85.00, 9/13/22, $79.25)
ESTC continues to consolidate in the handle area of its cup with handle pattern. While the position is currently down, this continues to hold the 10 week and 50 day moving average.
SWAV 0.00%↑ ($293.72, 9/14/22, $276)
SWAV is now 3 weeks into a potential flat base. There was a nice multitouch trendline coming down from the highs that it got above intraday but was unable to close there. I am currently down on the position, but this continues to consolidate showing massive RS virtually unchanged for the week when the market was down over 5%.
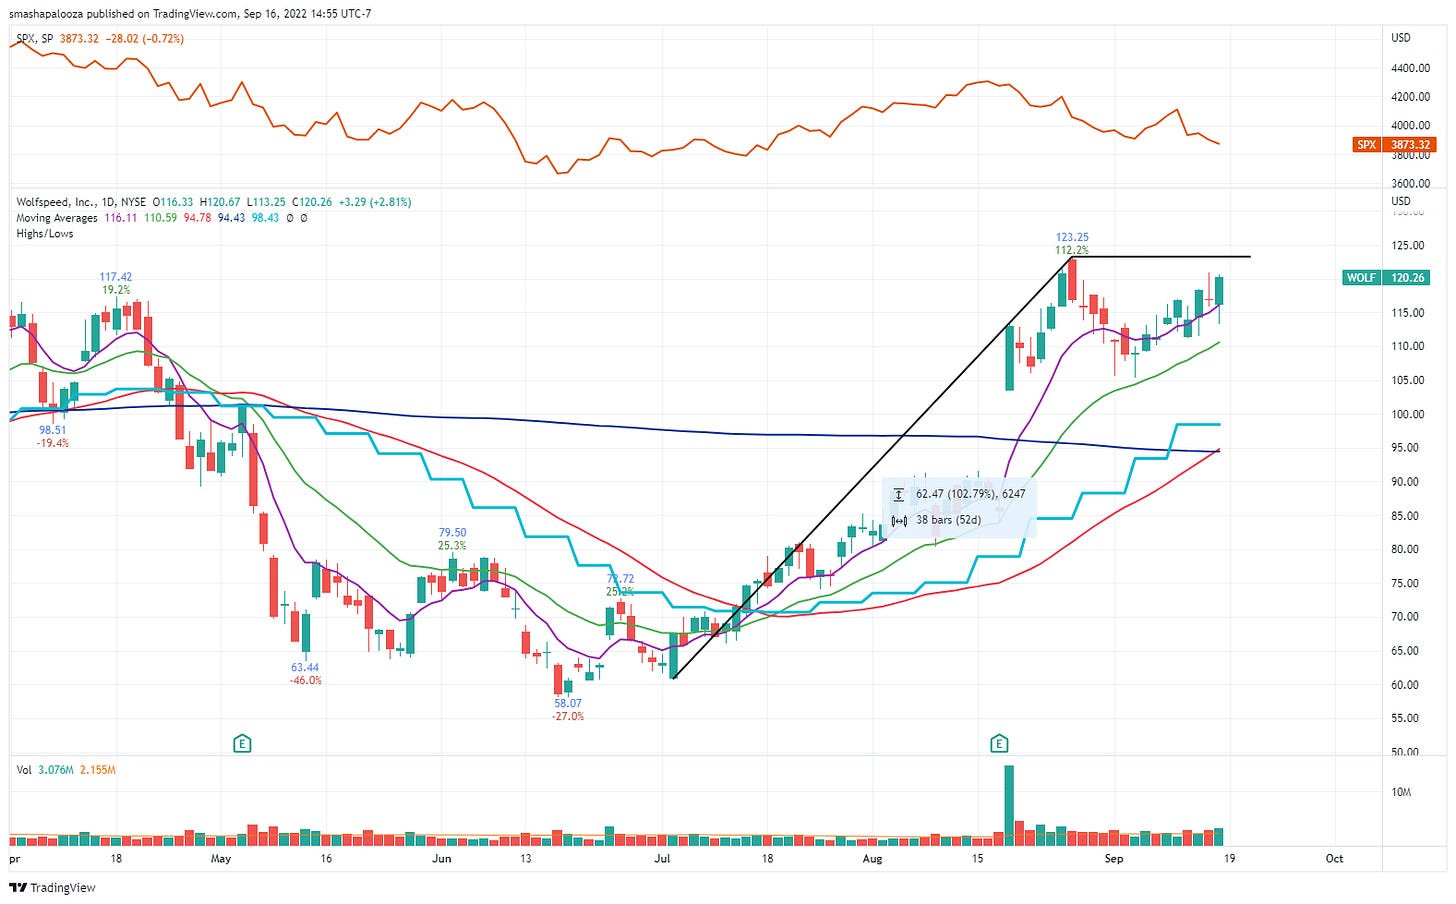
WOLF 0.00%↑ ($112.50, 9/7/22, $109)
WOLF was one of the best performing stocks of the week up 5.3% while the market was down over 5%. Not only was WOLF up and closed near the highs it did so on increasing volume. Tremendous RS that deserves attention.
Actions taken:
Bought: ESTC 0.00%↑ , SWAV 0.00%↑
Sold:
Potential Leaders:
CELH, CMG, DV, DVN, ENPH, EQT, ESTC, GFS, LNG, LNTH, LPLA, ON, OXY, PCTY, PI, PRVA, SWAV, TSLA, WOLF
Additions: GFS, TSLA, WSC
Removed: ARRY, NFE, GLNG
https://www.tradingview.com/watchlists/84325802/
Actionable Ideas:
Stocks listed in the actionable buys are stocks with strong fundamentals and showing good technical action that can offer a low-risk entry. Not every entry will trigger, but also just because a stock is listed here does trigger does not mean I will take the trade. Portfolio exposure, market health and other factors will also be considered.
ESTC 0.00%↑ – Kicker – Open above $82.09
ESTC has the potential for a kicker on Monday morning with a gap up open above $82.09. I like this spot right near the 10 week and 50 day moving averages. Friday 9/16 low would be my stop for less than 2% risk on the trade.
GFS 0.00%↑ – Kicker – Open above $58.40
GFS has the potential for a kicker on Monday morning with a gap up open above $58.40. This has now formed a 15% 5 week flat base with great volume pattern and has nice trendline coming down from the highs to offer a potential spot to add. If the kicker were to fail, it would signify that the base needs more time and could morph into a different base since it is near the 15% low threshold of a flat base. My stop would be Friday 9/16 low or a close below the 10 week line.
WOLF 0.00%↑ – High Tight Flag - $123.35
After a 102% move in 8 weeks WOLF has now flagged off and completed a high tight flag base, correcting less than 15%. A move above the flag pole high of $123.25 would be a breakout and need considerable volume to be actionable. Buying breakouts is risky in this current environment, but the RS WOLF has been displaying can not be ignored.
References
Thanks for reading! If you enjoyed this article please help support my work by doing the following:
Follow me on Twitter @smashapalooza16
Share this post using the button below
The content presented is for informational and educational purposes only. Nothing contained in this newsletter should be construed as financial advice or a recommendation to buy or sell any security. Please do your own due diligence or contact a licensed financial advisor as participating in the financial markets involves risk.


Good stuff!