Mike Webster (Webby) is a portfolio manager for a private fund and the former IBD Head Market Strategist and O’Neil Capital Management portfolio manger.
Webby recently returned to IBD live and discussed 4 indicators he is using on his charts. Due to Webby’s fund structure he is unable to share the source codes for his indicators, however I was able to recreate them based on his descriptions shared. I will post a link to the video below.
Webby’s RSI 2.0 - Measures a securities extension from the 21-day exponential moving average based on the 50 day average true range.
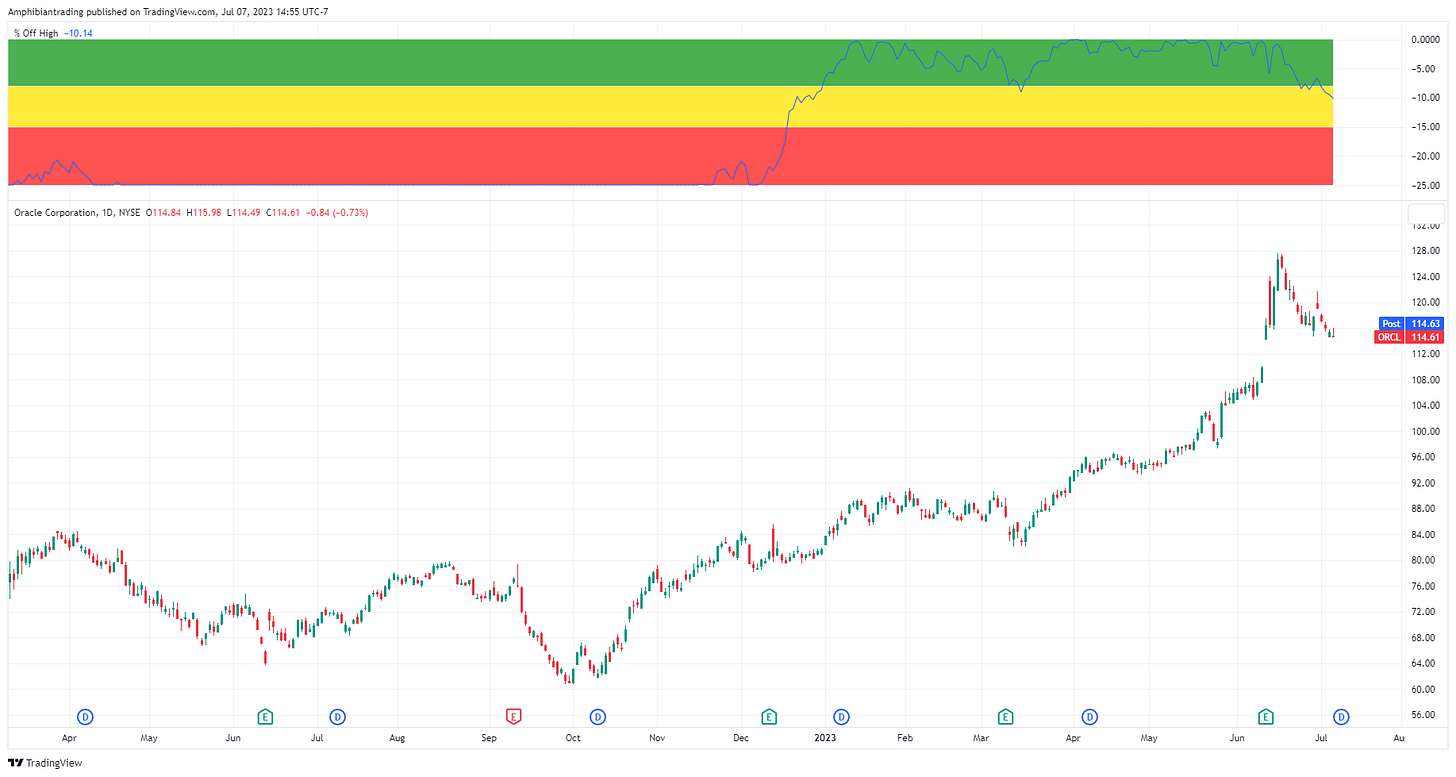
Webby’s % Off 52 Week High - Measures a securities distance from its 52 week high.
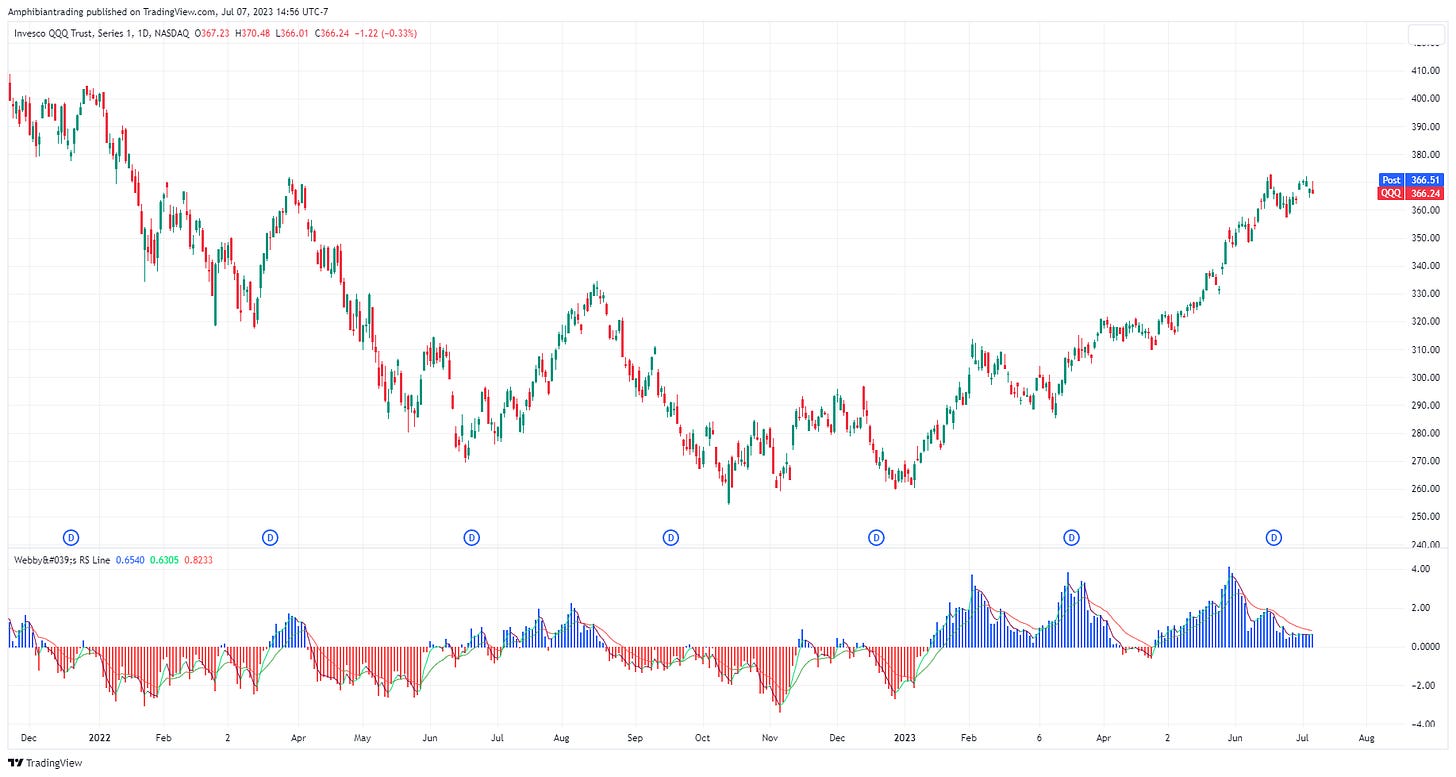
Webby’s RS Line - A histogram of the distance between the RS Line and the 21-day exponential moving average of the RS Line based on the lows.
Webby’s Tight Indicator - Measures a securities volatility relative to itself over time.
Webby talking about the indicators.
Thanks for reading! If you enjoyed this article or these indicators please help support my work by doing the following:
Follow me on Twitter @amphtrading
Share this post using the button below
The content presented is for informational and educational purposes only. Nothing contained in this newsletter should be construed as financial advice or a recommendation to buy or sell any security. Please do your own due diligence or contact a licensed financial advisor as participating in the financial markets involves risk.


