


The Nasdaq finished the short Holiday week up slightly and remains in its bullish structure of higher highs and higher lows. As expected, volume was very light this week. The Nasdaq continues to stay above the 21 ema and show constructive price action.
Wednesday saw a slew of economic data get released including the FOMC minutes. The market was waiting to see if the minutes would match the dovish tone of the Feds last policy statement or the hawkish tone of Chairman Powell’s press conference. The minutes came in in line with the statement, noting that the fed will look at incoming data and a slower pace of hikes would allow the Fed to better assess progress given uncertain lags with monetary policy.

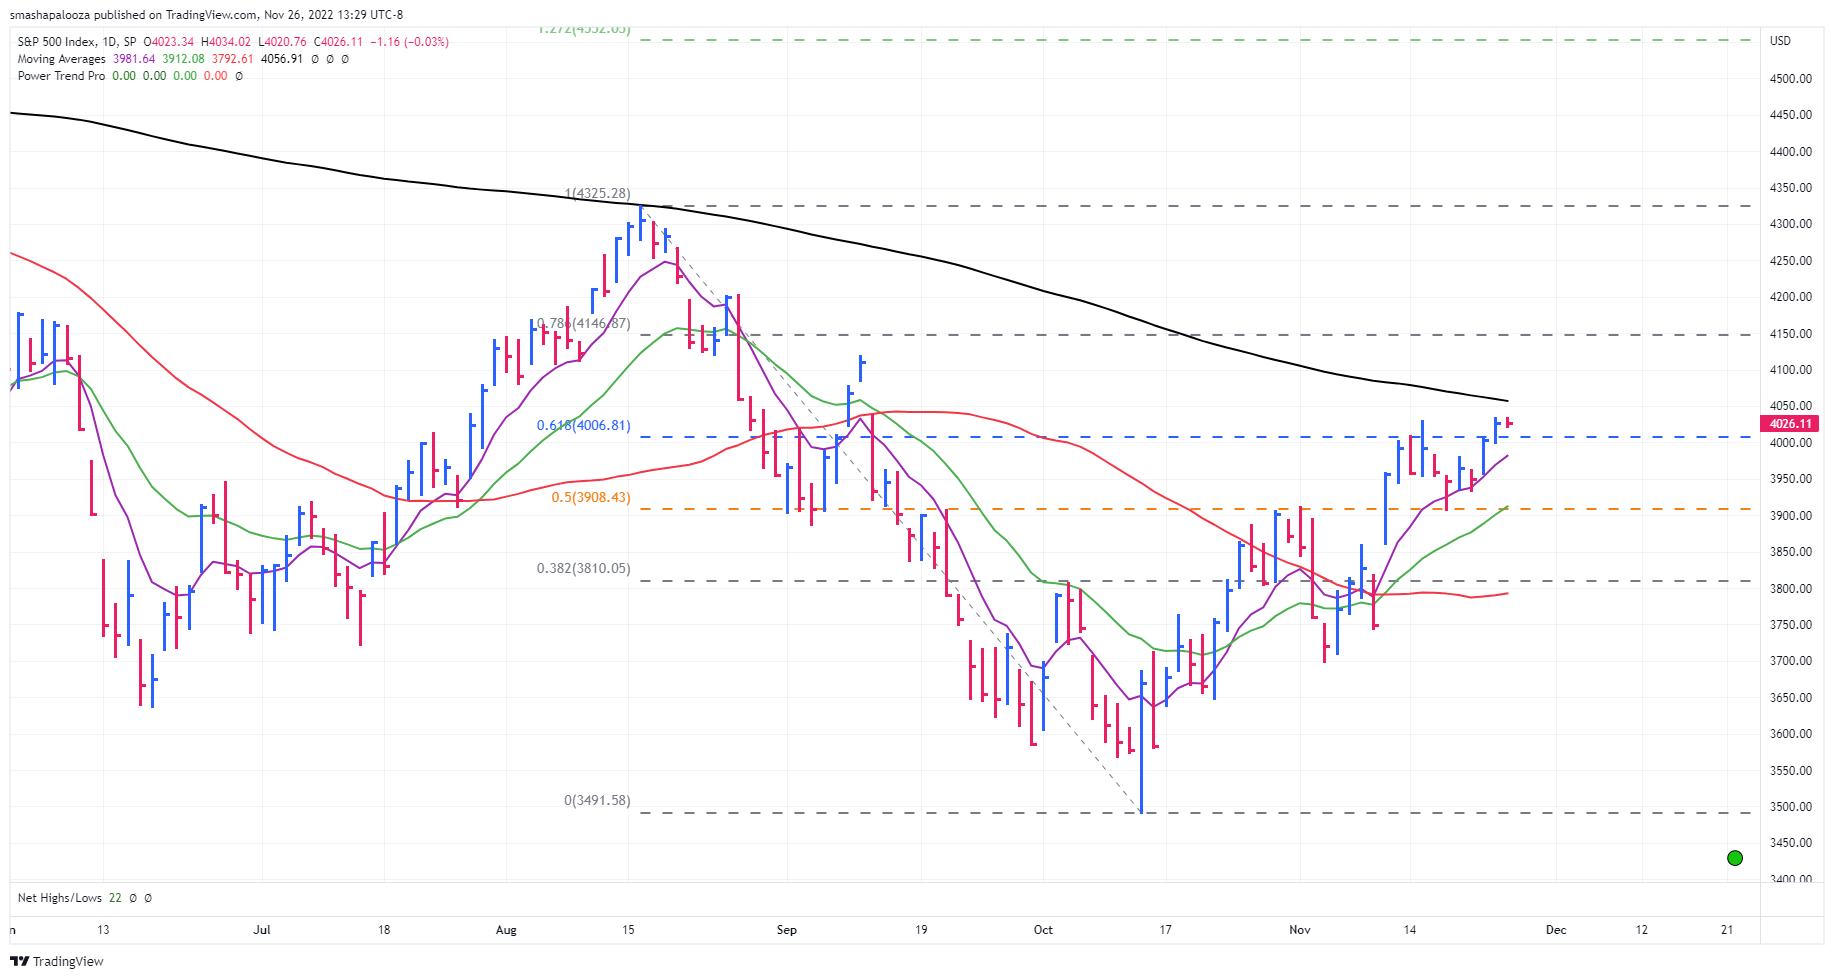
The SPX put in a higher high this week and sits less than 1% away from the 200-day moving average. For now, the index has pushed above the 61.8% retracement and the 4000 psychological level. I’d like to see those levels held if we retest them. The SPX has also triggered a Power Trend, which is normally a bullish sign for equities. See my tweet below with the criteria for the Power Trend. The previous rally attempt from June to August ended swiftly at the 200-day moving average. We will have to see if this time is different. It would be natural to have some resistance here, however last week I laid out my bullish thesis on why I think this time is different, but we will follow price and act accordingly.


The dollar continues to fall and seems destined to test its own 200 day moving average after breaking down from a bear flag. Yields also moved lower this week with the 2-year finding support at the 10-week moving average, while the 10 year continues to fall finding resistance at the 8 ema after breaking down from a bear flag. One thing I am watching on the 2 year yield is a multitouch trendline that has formed. Ideally this will act as resistance and the 2 year will fall, however if it can break above the trendline it could spell trouble for equities. The VIX has fallen very rapidly down to levels not seen since August where the previous rally attempt died.


Friday’s Breadth

Before we dive into my market outlook, current positions, and trading plan make sure you are subscribed so that you don’t miss any future updates!

Next week we are back to our regular schedule and have a ton of economic reports. The big ones being PCE, nonfarm payrolls and the unemployment rate. The trio of reports will give some insight into the Feds actions and could spark major moves in the market either way.
I continue to be bullish on the market and expect further upside from here. Last week we looked at the AAII as a way to gauge investors sentiment and while this week’s bearish number remains elevated at 40.2% (exact same amount as last week) the number of bullish participants dropped 4.5% to 28.9%. The neutral view is the only category that increased.

On top of that we are still seeing strong technical action. As I mentioned last week many stocks are starting to complete proper bases and breakout. The biggest character change though has come in from stocks actually holding breakouts and not being met with immediate distribution.

Current Positions: ANET 0.00%↑ , ENPH 0.00%↑ , LULU 0.00%↑ , ON 0.00%↑ , PODD 0.00%↑ , WING 0.00%↑
As a whole I was pleased with the overall action of my positions this week. I had one mistake this week by not rebuying CELH after being shaken out, and I will be watching that one very closely still. I did, however, add two new positions in WING and PODD.
ANET 0.00%↑ – Tight weekly close and remains above the weekly trendline. Low volume week.
ENPH 0.00%↑ – Finally managed to get and close above the $313 level. New weekly closing high but stopped just shy of hitting new all time highs.
LULU 0.00%↑ – Closed the week near the highs on light volume. Sits right below a weekly downtrend line from all-time highs.
ON 0.00%↑ - Continues to consolidate right below all-time highs. Light volume and overall constructive action.
PODD 0.00%↑ – Pulled back to the low of its earnings gap up and staged an upside reversal bar. I initiated this as price pushed above the high of the upside reversal bar. The weekly chart shows 3 tight weekly closes.
WING 0.00%↑ – Pulled back to and bounced from the 21 ema. I initiated the next day as price broke above the high of the upside reversal day. Lightest volume week of the entire year.

Watchlist: https://www.tradingview.com/watchlists/84325802/
My focus remains on finding additional low risk entries in the coming days and weeks to size up into my current holdings. As always risk management is the number one goal so I will keep an eye out for any red flags.
After being shaken out on Tuesday, I should have rebought this on Wednesday as it pushed over Tuesdays high. This also pushed above the trendline and channel it was trading in. The relative strength line is at new highs and now I will be watching this to potentially form a handle as it works up the right side of its cup base. Volume has been coming back into this one after 10 weeks of consolidating and this will remain a top focus for me going forward.

GFS is a young IPO that has finally formed its first proper base. The weekly chart shows tons of accumulation and a strong volume profile. This broke out of a 13-week 29% deep cup base and now has a tight weekly close. I will be watching this to hopefully pullback to the 21 ema. It may not happen, but if it does, I will be ready to pounce. This remains my favorite idea.

Since breaking out of its cup with handle base LULU has held above the breakout level and the left side high of the base. That is something that we haven’t seen much of this year. LULU has formed a nice flag with a multitouch trendline. If LULU can push above the trendline I will look to add to my position.

PODD had a massive earnings gap breaking out of a cup base. Since then, there has been an orderly pullback to the low of the gap up day which sits just above the 21 ema. After staging an upside reversal candle, this was buyable the next day as it pushed over the high of the upside reversal. This buy already triggered; however, it remains right in buy range and is still actionable. I initiated this position on Friday.

RMBS broke out of a cup base 4 weeks ago and now has 3 tight weekly closes and a flag. The weekly chart shows very nice accumulation, and I would consider this for a swing trade if it can push above the trendline since this is very extended from the 10 week and 50 day moving averages.

I initiated this Wednesday; however, the setup is still valid as it closed slightly below the pivot. WING broke out of its most recent base with a strong earnings gap. After consolidating recent gains, it came down and touched the 21 ema before staging an upside reversal. If this can get back above yesterday’s highs it will trigger a pullback buy. This also has potential for a low-risk kicker pattern near the 21 ema on Monday if it gaps above Fridays open of $156.81.

Stocks listed in Next Weeks Plan are stocks with strong fundamentals and showing good technical action that can offer a low-risk entry. Not every entry will trigger, but also just because a stock is listed here does trigger does not mean I will take the trade. Portfolio exposure, market health and other factors will also be considered.
Thanks for reading! If you enjoyed this article please help support my work by doing the following:
Follow me on Twitter @amphtrading
Share this post using the button below
The content presented is for informational and educational purposes only. Nothing contained in this newsletter should be construed as financial advice or a recommendation to buy or sell any security. Please do your own due diligence or contact a licensed financial advisor as participating in the financial markets involves risk.